Visual Project Dashboard PPT Template and Google Slides

Dashboard slide displaying data through colorful bar charts, a pie chart, and a project timeline with phase completions.
P.ID : 443
    18.1K+ views
    1.8K+ Downloads
    Get Custom Slides by Experts
    Instantly Access Templates in PowerPoint

    Better Way to Present Your Project KPIs

    When managing performance, it is important for any business to monitor its processes and people. To do this, this well-crafted PPT template is a must-have tool. It enables you to measure how well your organization is performing financially and improves the quality and standards of management accountability. With this right tool, management can set goals and objectives and monitor performance in the most effective manner.

    About the template

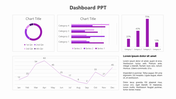
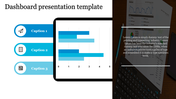
    It is a multicolor template with the best editing features. It has a well-designed dashboard to analyze your KPIs. It is a cost-effective way to track and manage the data of your project. You can create an informative presentation using this well-designed template. Many creative slides are available at Slide Egg, from project to social media dashboard templates. Download Now!

    Features of the template

    • It is 100 % customizable slides and easy to download.
    • Slides are available in different nodes & colors.
    • The slide has 16:9 and 4:3 formats.
    • Easy to change the slide colors quickly.
    • Well-crafted template with instant download facility.
    • Stunning dashboard design.
    Advertisement

    You May Also Like These PowerPoint Templates

    Free
    Add to Wishlist
    Download
    AI Customize
    Speedometer graphic with a blue progress bar, labeled distance values, and a right-side text box explaining its concept.
    Add to Wishlist
    Download
    AI Customize
    Circular tachometer gauge with a needle pointing six colored sections, and captions in rounded rectangles connected by lines.
    Free
    Add to Wishlist
    Download
    AI Customize
    Circular gauge style infographic in shades of gray, showing a speedometer with a needle and distance markers.
    Add to Wishlist
    Download
    AI Customize
    Business executive dashboard template displaying project information, including date and editor with placeholder text.
    Add to Wishlist
    Download
    AI Customize
    A tachometer PowerPoint template with five dials in different colors, each representing a specific section with captions.
    Add to Wishlist
    Download
    AI Customize
    Dashboard themed slide with a semi circular gauge showing four icons for speedometers and a central needle pointer.
    Add to Wishlist
    Download
    AI Customize
    Dashboard layout with gauges, bar charts, line graphs, and progress indicators for business performance metrics.
    Add to Wishlist
    Download
    AI Customize
    Green speedometer graphics illustrating performance levels at 70, 50, 55, and 85 percent in a PowerPoint template.
    Add to Wishlist
    Download
    AI Customize
    A tachometer graphic for PowerPoint, featuring different colored sections and text placeholders.
    Add to Wishlist
    Download
    AI Customize
    Four yellow speedometer graphics showing percentages of 70%, 50%, 55%, and 85% placed in a white background.
    Add to Wishlist
    Download
    AI Customize
    Dashboard PowerPoint template with progress bars, circular steps, and a multi color bar chart for tracking metrics.
    Add to Wishlist
    Download
    AI Customize
    Dashboard template showing last deposit, transaction, payment types, and data market percentages.
    Add to Wishlist
    Download
    AI Customize
    Colorful speedometer PPT slide with a gauge showing 25 percent and corresponding happy and sad faces with captions.
    Add to Wishlist
    Download
    AI Customize
    Logistics performance dashboard with two circular charts for failure distribution and delivery tracking, and a gauge meter.
    Add to Wishlist
    Download
    AI Customize
    Tachometer PPT slide with 4 colorful gauges in red, orange, green, and blue, each with caption sections on a white backdrop.
    Add to Wishlist
    Download
    AI Customize
    Dashboard PowerPoint slide featuring pie, bar, and line charts with placeholder text and data visualization.