Metrics Dashboard PowerPoint Template & Google Slides

Metrics Dashboard PowerPoint Template & Google Slides
P.ID : 51471
    622 views
    72 Downloads
    Get Custom Slides by Experts
    Instantly Access Templates in PowerPoint

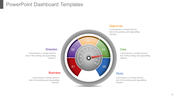
    Dashboard PowerPoint Template Slide

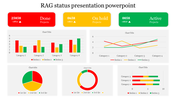
    Inspired by the metrics dashboard PowerPoint template for contemporary Windows operating systems, this template provides tiled layouts in PowerPoint to help you quickly present all kinds of data using fewer slides. The sample slides are designed like metrics dashboard PPT, and you can fill in your ideas by editing with your content. 

    About the template

    Download this metrics dashboard. PowerPoint template layouts are beneficial for displaying analytics, trends, target market, and maps. This single slide template might help discuss demographics, market segments, product outreach, financial forecasts, etc. SlideEgg makes your presentation work simple and easy for any official and personal conference. Choose this multicolor template and scour your eminence to shine well among your technology partners.

    Features of the Template:

    • Innovative slide background designs
    • 100% easy to edit and customize slides
    • The slide contained 16:9 and 4:3 formats.
    • Easy to change the slide colors quickly.
    • The elegant look of this template will give life to your presentation.
    • Crisp and clear font styles.
    • Awesome dashboard PPT Slide.
    Advertisement

    You May Also Like These PowerPoint Templates

    Add to Wishlist
    Download
    AI Customize
    A line graph showing a plot structure with key points marked by colored dots, representing key stages.
    Add to Wishlist
    Download
    AI Customize
    Slide deck showcasing various pie chart infographics in different colors and sections for data visualization.
    Add to Wishlist
    Download
    AI Customize
    Sentiment meter infographic displaying six emotions in a colorful fan design, each labeled with placeholders text areas.
    Free
    Add to Wishlist
    Download
    AI Customize
    Slide deck showcasing KWL chart layouts with colorful sections in purple, yellow, and teal, for structured insights.
    Add to Wishlist
    Download
    AI Customize
    Chart guide slide with two green-tone line graphs displaying data points, captions on the right, and a text footer.
    Free
    Add to Wishlist
    Download
    AI Customize
    Pie chart illustration showcasing five data segments in varying colors with percentage labels and connected captions areas.
    Add to Wishlist
    Download
    AI Customize
    Vertical Microsoft infographic with four colored arrows each labeled with icons for business, target, analytics, and money.
    Add to Wishlist
    Download
    AI Customize
    Steps to growth slide featuring a chart with four arrows indicating yearly growth percentages and a large text section.
    Add to Wishlist
    Download
    AI Customize
    Tachometer template with percentage markers and color-coded designs, each paired with caption areas.
    Free
    Add to Wishlist
    Download
    AI Customize
    Comparison bar chart showing percentage values from 2011 to 2019 for chat and security categories.
    Add to Wishlist
    Download
    AI Customize
    Slide showcasing four circular progress charts with percentages in alternating teal and black accents.
    Add to Wishlist
    Download
    AI Customize
    PowerPoint slide featuring a project dashboard with bar charts and a pie chart displaying project data and progress.
    Add to Wishlist
    Download
    AI Customize
    Project status dashboard slide displaying budgets and performance metrics for banners, social media, and brochures.
    Add to Wishlist
    Download
    AI Customize
    PowerPoint slide with a tachometer graphic showing numbers 1 through 8 in different colors, with placeholders for captions.
    Add to Wishlist
    Download
    AI Customize
    Colorful tachometer PowerPoint slide design with transportation icons including airplane, car, bus, and train with captions.
    Add to Wishlist
    Download
    AI Customize
    Ten speedometer icons in two rows, each with blue, green, and red segments, ranging from 0 to 100.
    Add to Wishlist
    Download
    AI Customize
    Tachometer slide with four gauges in orange, red, blue, and green, each with captions below describing different readings.