Editable KPI Dashboard PowerPoint And Google Slides Template

KPI dashboard slide with progress indicators, including bars for technology, accessibility, security, and various activities.
P.ID : 10527
    1.8K+ views
    223 Downloads
    Get Custom Slides by Experts
    Instantly Access Templates in PowerPoint

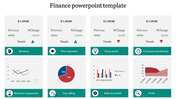
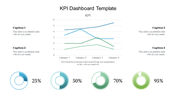
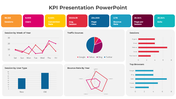
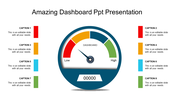
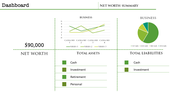
    KPI Dashboard PowerPoint Slide


    Elevate your performance tracking with our KPI dashboard PPT template, designed to streamline your key performance indicator (KPI) monitoring process. This comprehensive template offers a wealth of helpful content, guiding you through the essential metrics and insights needed to gauge your organizational performance effectively. This template is 100% editable and customizable, allowing you to tailor the content to meet your specific KPI requirements. Maximize your productivity and decision-making with our KPI dashboard PPT template. Download it today to unlock the potential of your performance analysis efforts. With its professional design and customizable features, this template empowers you to create dynamic KPI dashboards that drive strategic decision-making and business growth. Don't miss out download this template now and take your performance tracking to new heights!

    Features of this template


    • 100% customizable slides and easy to download.
    • The slide contains 16:9 and 4:3 formats.
    • Easy to change the colors of the slide quickly.
    • Highly compatible with PowerPoint and Google Slides.
    Advertisement

    You May Also Like These PowerPoint Templates

    Free
    Add to Wishlist
    Download
    AI Customize
    PowerPoint template featuring a colorful dashboard with bar graphs, pie charts, progress rings, and a timeline for data.
    Free
    Add to Wishlist
    Download
    AI Customize
    Free KPI PPT Template For Presentation & Google Slides
    Free
    Add to Wishlist
    Download
    AI Customize
    Dashboard layout includes a line graph, pie chart, and three bar graphs, all colored in red, green, and blue.
    Add to Wishlist
    Download
    AI Customize
    KPI dashboard slide featuring six charts vertical bars, horizontal bars, area graph, pie chart, and column bar graphs.
    Add to Wishlist
    Download
    AI Customize
    KPI dashboard highlighting supplier statistics using donut charts, order-to-invoice process, and bar charts.
    Free
    Add to Wishlist
    Download
    AI Customize
    A slide with a sleek dashboard design that includes colorful data visualizations like pie charts, graphs, and progress bars.
    Free
    Add to Wishlist
    Download
    AI Customize
    Project progress dashboard with bar graphs, pie charts, and key metrics displayed on a blue and orange theme.
    Free
    Add to Wishlist
    Download
    AI Customize
    KPI slide displaying three circular meters with red, green, and orange sections, with text descriptions on the right.
    Free
    Add to Wishlist
    Download
    AI Customize
    KPI PPT Template with three colourful circular progress charts  showing percentages, growth indicators, and  bar charts.
    Free
    Add to Wishlist
    Download
    AI Customize
    Semi circular speedometer graphic with red to yellow gradient, and three placeholder text below.
    Add to Wishlist
    Download
    AI Customize
    RAG status slide with a task table featuring colored status indicators and four charts, including pie and line graphs.
    Add to Wishlist
    Download
    AI Customize
    KPI dashboard slide showing multiple charts, including bar, line, pie, and gauge charts with tracking business data.
    Free
    Add to Wishlist
    Download
    AI Customize
    KPI Template PPT Presentation Slide With Bar Chart
    Add to Wishlist
    Download
    AI Customize
    Three speedometer charts slide with captions indicating different data points, highlighted in green, yellow, and orange.
    Free
    Add to Wishlist
    Download
    AI Customize
    Free Dashboard PowerPoint Template Design template
    Add to Wishlist
    Download
    AI Customize
    Three semi circle gauges in pastel colors, with percentage labels above, and related text and icons beneath.
    Add to Wishlist
    Download
    AI Customize
    Three speedometers showing progress percentages: 25%, 50%, and 75%, with gradient colors in yellow, orange, and red.
    Free
    Add to Wishlist
    Download
    AI Customize
    Slide with three gauge meters in orange, yellow, and gray, each paired with a table for KPI metrics.