Slidea Logo
Try it now — the new, easy way to turn your slides into an interactive experience.
Explore Now

Best Dark Mode Dashboard PowerPoint And Google Slides

Pack of 12 slides
P.ID : 76852
Advertisement
1 views
1 Downloads
Get Custom Slides by Experts
Enhance Your Presentations with Add-ins
Google Slides Add-in
Access templates directly in Google Slides
Microsoft PowerPoint Add-in
Access templates directly in PowerPoint
GPT Add-on
AI-powered presentation assistance

Dark Mode Dashboard PowerPoint, Google Slides, and Canva Template


Bring focus and clarity to your business data with this visually powerful dark mode dashboard presentation template. Designed with a modern dark theme, this 5-slide deck helps highlight key metrics while reducing visual noise. It is perfect for business professionals, analysts, sales teams, and decision-makers who want clean, high-impact dashboards.

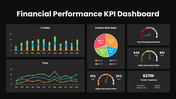
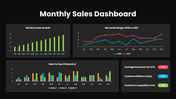
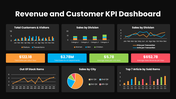
This presentation includes essential views such as the Customer Dashboard, Financial Performance KPI Dashboard, Monthly Sales Dashboard, and Revenue and Customer KPI Dashboard. Each slide is thoughtfully structured to display trends, comparisons, and performance indicators clearly, making it easier to analyze data and communicate insights during meetings or reviews.

The dark background combined with vibrant data visuals ensures better readability and a premium look. Fully editable and easy to customize, this dashboard PPT fits a wide range of business use cases, from executive reporting to sales and finance analysis.


Present your data with confidence and style. Download the Dark Mode Dashboard presentation today and create dashboards that stand out instantly. Turn your business numbers into clear, compelling stories your audience will remember.


Features of this template

  • 100% customizable slides and easy to download.
  • The slides contain 16:9 and 4:3 formats.
  • Easy to change the colors quickly.
  • Highly compatible with PowerPoint, Google Slides, and Canva templates.

You May Also Like These PowerPoint Templates

Free
Add to Wishlist
Download
AI Customize
Pie chart in orange, red, green, and blue sections with two text labels on either side, highlighting sales performance.
Free
Add to Wishlist
Download
AI Customize
Business slide featuring a circular layout with four orange sections and icons representing key aspects of business.
Free
Add to Wishlist
Download
AI Customize
PowerPoint slide with a project dashboard showing two speedometers to represent project progress with captions.
Add to Wishlist
Download
AI Customize
KPI themed slide with data visualization including pie charts, bar graphs, line graphs, and key metrics.
Add to Wishlist
Download
AI Customize
Logistics performance dashboard with two circular charts for failure distribution and delivery tracking, and a gauge meter.
Add to Wishlist
Download
AI Customize
KPI PowerPoint slide featuring three colored gauges for Revenue, Sales, and Sales Value with respective values.
Add to Wishlist
Download
AI Customize
Concentric pentagons in black with text areas around each corner, forming a simple monochrome layout.
Add to Wishlist
Download
AI Customize
KPI template displaying financial metrics, including sales, profitability, liquidity, and leverage, with two gauge charts.
Add to Wishlist
Download
AI Customize
Project summary dashboard showing project statistics, budget, actual performance, and project performance by category.
Free
Add to Wishlist
Download
AI Customize
Five-level bar chart executive dashboard with colored blocks labeled with five levels, showing a gradual progression.
Add to Wishlist
Download
AI Customize
Template displaying a structured flowchart for KPI types, categorized into qualitative and quantitative evaluations.
Add to Wishlist
Download
AI Customize
Botanical data dashboard template  showing performance metrics for flower species, featuring line and bar charts.
Add to Wishlist
Download
AI Customize
KPI dashboard template PowerPoint slide featuring three sections for data visualization.
Add to Wishlist
Download
AI Customize
KPI dashboard template with six sections which includes charts, graphs, and numerical data.
Add to Wishlist
Download
AI Customize
Four colored circular progress, one is higlighted in a box with a pie chart, and a bar chart labelled with sections.
Add to Wishlist
Download
AI Customize
Slide with a businesswoman standing beside a colorful ring chart labeled on a board and four captions on the right.