Affordable Dashboard PPT Template Presentation Slides

Dashboard PPT template with three colored gauges showing 30, 60, and 90 percent completion with captions.
P.ID : 18835
    779 views
    66 Downloads
    Designer
    Kavitha
    Get Custom Slides by Experts
    Enhance Your Presentations with Add-ins
    Google Slides Add-in
    Access templates directly in Google Slides
    Microsoft PowerPoint Add-in
    Access templates directly in PowerPoint
    GPT Add-on
    AI-powered presentation assistance

    Editable Dashboard PPT Template


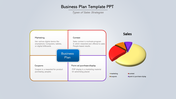
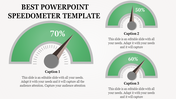
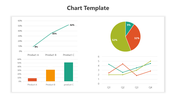
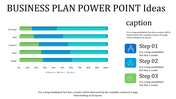
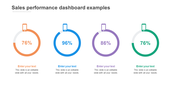
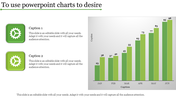
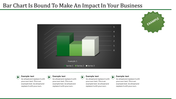
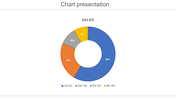
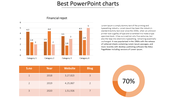
    Imagine turning your complex data into a brilliant, easy-to-understand narrative that engages your audience from the first slide. With our editable dashboard PPT template, you can do just that. This template features a clean and modern layout with three main speedometer dials that can be customized to display your most important metrics. You can add charts, graphs, and tables to further illustrate your data points. In addition, the template includes a customizable theme to provide context and insight for each visual element.


    These templates are perfect for business presentations, marketing reports, sales pitches, and more. It will help you better communicate your data to your colleagues, customers, and investors. Use this template to create wonderful presentations for school projects, research papers, and group assignments. It will help you stand out from the crowd and gain the lasting attention of your teachers and peers. Download our dashboard PPT Templates and Google Slides Themes today.


    Features of the template:


    •  Slides are available in 4:3 & 16:9
    • Well-crafted template with instant download.
    • Get slides that are 100% customizable and easy to download.
    Advertisement

    You May Also Like These PowerPoint Templates

    Free
    Add to Wishlist
    Download
    Edit
    Bar chart with five purple cylinders and percentages arranged from left to right, next to a professional woman in a suit.
    Free
    Add to Wishlist
    Download
    Edit
    Bar chart with four vertical colored columns in green, blue, yellow, and red, with gray tops and captions above.
    Add to Wishlist
    Download
    Edit
    Four vertical 3D bars with percentages in red, pink, blue, and purple shades, aligned with captions.
    Free
    Add to Wishlist
    Download
    Edit
    Four cylindrical blue bars in a row next to a woman in a black suit in a simple design layout.
    Free
    Add to Wishlist
    Download
    Edit
    Green bar chart PowerPoint slide with percentages for the years 2017 through 2021 and a woman standing next to the chart.
    Add to Wishlist
    Download
    Edit
    3D bar chart infographic showing four blocks in blue, green, red, and orange with percentages and captions.