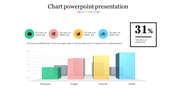
Free - Use Pie Chart Images PowerPoint Presentation Template

Free
Pie chart with four segments in white and green on a dark patterned background, alongside a text box for description.
P.ID : 4242
    374 views
    68 Downloads
    Get Custom Slides by Experts
    Instantly Access Templates in PowerPoint

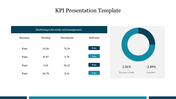
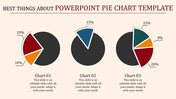
    Creative Template With Circular Nodes:


    The enchanting blue background in this pie chart images PowerPoint Template is the most adorable feature over here. The circular node is split into four parts that can illustrate the parts of a specified topic. You are provided with a large green node to enter your facts related to your topic.

     Since it is a ready-made template, you can use them by just inserting your details in them. Look at the bottom of the Template, and there is another horizontal node to enter your facts in this node here, and you can enter the conclusion of your topic. Get started with this pie chart images PowerPoint Template now for best results.

    Features of this Template:

    • 100% customizable slides and easy to download.
    • Slides available in different nodes & colors.
    • The Slide contained 16:9 and 4:3 format.
    • Easy to change the slide colors quickly.
    • Well-crafted Template with instant download facility.
    • Attractive nodes to represent more information.
    • Elegant and particular font styles.
    Advertisement

    You May Also Like These PowerPoint Templates

    Add to Wishlist
    Download
    AI Customize
    Area chart with a teal base and five markers in yellow, red, and maroon shades representing growth percentages.
    Add to Wishlist
    Download
    AI Customize
    Pie Chart PowerPoint with Segmented Circles Slides
    Add to Wishlist
    Download
    AI Customize
    Illustration of a chart with yellow, red, and green horizontal bars displaying percentages and paper boat icons on waves.
    Add to Wishlist
    Download
    AI Customize
    A vertical green color bar chart slide displaying loss data from 2014 to 2019, with the title at the top.
    Add to Wishlist
    Download
    AI Customize
    Donut chart with four colorful quadrants and text placeholders, connected by lines to circular percentage labels around it.
    Add to Wishlist
    Download
    AI Customize
    A colorful pie chart diagram with concentric circles showing percentages for different data categories in 2021.
    Free
    Add to Wishlist
    Download
    AI Customize
    Gantt chart slide showing six tasks with progress bars, each reflecting completion levels ranging from 30% to 80%.
    Add to Wishlist
    Download
    AI Customize
    Four orange pie charts with center numbers from 01 to 04, each with text placeholders on the right.
    Free
    Add to Wishlist
    Download
    AI Customize
    Line chart showing traction growth with two labeled data points in green and blue, alongside thumbs up and thumbs down icons.
    Add to Wishlist
    Download
    AI Customize
    Horizontal Gantt chart with blue bars representing tasks, timeline from March to April 2020, and gray grid lines.
    Free
    Add to Wishlist
    Download
    AI Customize
    Line chart template with two data series on a dark background, featuring a calculator and pen in the background.
    Add to Wishlist
    Download
    AI Customize
    Colorful progress bars in rows, showing numbered squares in red, teal, purple, and blue, with text on the right.
    Add to Wishlist
    Download
    AI Customize
    Professional setting with pie charts showing task distribution in red tones for analysis, collection, and development.
    Add to Wishlist
    Download
    AI Customize
    Dashboard chart displaying social media subscribers by gender, age, most read articles, and categories in 2019.
    Add to Wishlist
    Download
    AI Customize
    Six-month Gantt chart template spanning July to December 2020 with weekly divisions and task rows.
    Add to Wishlist
    Download
    AI Customize
    Chart showing blue bars representing growth metric alongside an orange line marking an ascending trend over eight categories.
    Free
    Add to Wishlist
    Download
    AI Customize
    Line chart in teal showing data points from 2013 to 2020 on a white background, with five icons listed on the right.
    Free
    Add to Wishlist
    Download
    AI Customize
    Histogram on the left and Pareto chart in pink and orange with cumulative line on the right.
    Free
    Add to Wishlist
    Download
    AI Customize
    Four blue pyramid shapes in ascending size, labeled with percentages, aligned over a horizontal gray bar.