Editable Traction PPT Download For Presentation

Chart showing blue bars representing growth metric alongside an orange line marking an ascending trend over eight categories.
P.ID : 43775
    271 views
    35 Downloads
    Get Custom Slides by Experts
    Instantly Access Templates in PowerPoint

    Traction PPT For Presentation


    If you are searching for a way to improve your PPT or Proposal presentation, knowing what traction the PPT template is will help you greatly. A traction PPT download or presentation has to be simple, very clear, and concise to the point. In addition, you need to come up with a template that can be understood by your audience, as this is the quickest way to get your message across and ensure that you grab their attention. This template will help you know what traction PPT template is and how it can help you.


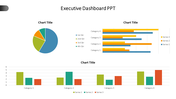
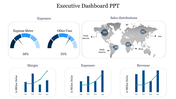
    It is an eight noded template with neat chart and bar designs. The dark blue theme plays a vital role in highlighting your data. The white theme background will hugely reflect your information to your audiences effectively to your audiences. You can easily edit the traction PPT download template designs and themes as per your need. Download this pre-designed slide to save your time and money.


    Features of this template:


    • It is 100 % customizable slides and easy to download.
    • The Slides are available in different nodes & colors.
    • The slide contained in 16:9 and 4:3 format.
    • It is easy to change the slide colors quickly.
    • It is a well-crafted template with an instant download facility.
    • It is the best chart theme template.

    Advertisement

    You May Also Like These PowerPoint Templates

    Add to Wishlist
    Download
    AI Customize
    KPI template displaying financial metrics, including sales, profitability, liquidity, and leverage, with two gauge charts.
    Add to Wishlist
    Download
    AI Customize
    Executive dashboard slide with a pie chart, bar graph, area chart, and a profile section for job title and details.
    Add to Wishlist
    Download
    AI Customize
    KPI template with three gauges displaying progress levels for sales, production, and downloads.
    Free
    Add to Wishlist
    Download
    AI Customize
    Business pie chart template with a car background, featuring sections labeled with text and pie chart values.
    Free
    Add to Wishlist
    Download
    AI Customize
    Marketing plan slide showing green bar chart with upward arrow, alongside three text and icons.
    Add to Wishlist
    Download
    AI Customize
    Customized PowerPoint Charts Template Presentation
    Add to Wishlist
    Download
    AI Customize
    A dashboard PPT slide with bar charts for Zantedeschia, Celosia, and Calendula, and three colorful gauge indicators.
    Add to Wishlist
    Download
    AI Customize
    Dashboard presentation slide with a line chart trend and circular charts highlighting project progress percentages.
    Add to Wishlist
    Download
    AI Customize
    Infographic charts for PowerPoint slide featuring bar, pie, and map charts in different styles and colors.
    Free
    Add to Wishlist
    Download
    AI Customize
    Five vertical purple bars in a row, each on a gray base, with a businesswoman figure on the right side.
    Add to Wishlist
    Download
    AI Customize
    Executive dashboard slide with gender bar chart, line graph,pie chart, and area chart for executive data analysis.
    Free
    Add to Wishlist
    Download
    AI Customize
    Template with six green bar graphs labeled by years from 2016 to 2021, and a woman in a formal outfit.
    Free
    Add to Wishlist
    Download
    AI Customize
    Bar chart comparing business targets and profits across quarters, with orange and blue bars labeled by month.
    Add to Wishlist
    Download
    AI Customize
    Electricity dashboard showing a bar chart on the left and a line chart on the right, depicting electricity data.
    Add to Wishlist
    Download
    AI Customize
    Dashboard slide with three gauges displaying percentage levels, labeled low, middle, and high with placeholder text.
    Add to Wishlist
    Download
    AI Customize
    Colorful pie chart in PowerPoint slide showing 60, 30, and 10 percent segments with text boxes on a white backdrop.
    Free
    Add to Wishlist
    Download
    AI Customize
    Five triangular red pyramids arranged by size with corresponding percentage values, set against a minimalist gray background.
    Add to Wishlist
    Download
    AI Customize
    Dashboard overview slide displaying traffic, payment, server load, expenses, and product metrics using graphs and charts.
    Free
    Add to Wishlist
    Download
    AI Customize
    Bar graph comparing financial data with blue and purple theme, with a text box explaining a high level approach.