KPI PowerPoint Template And Google Slides Themes

KPI template displaying financial metrics, including sales, profitability, liquidity, and leverage, with two gauge charts.
P.ID : 34190
    657 views
    76 Downloads
    Get Custom Slides by Experts
    Instantly Access Templates in PowerPoint

    KPI Presentation Template 

    Introducing our amazing KPI PowerPoint template and Google Slides. It's like a magic wand for your presentations. Imagine a slide that shows all your important numbers in clear, easy-to-read charts and graphs. With this KPI template, you don't need to be a design expert—just plug in your data and go! Whether you're a big-shot executive, a sales whiz, or a student, this template is perfect for you. It's super easy to use and makes your presentations look super professional. Plus, it saves you tons of time! No more fiddling with complicated designs or struggling to make your numbers make sense. Just download the template, add your info, and boom—your presentation is ready to impress. So why wait? Download our KPI PowerPoint template now and make your next presentation a breeze!

    Features of the template:

    • Slides are available in different nodes & colors.
    • Easy to change the slide colors.
    • Well-crafted template with instant download.
    Advertisement

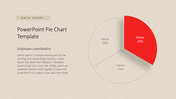
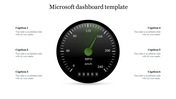
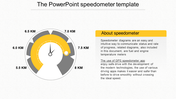
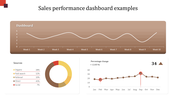
    You May Also Like These PowerPoint Templates

    Free
    Add to Wishlist
    Download
    AI Customize
    Line chart template with three data series in blue, teal, black, and text sections.
    Add to Wishlist
    Download
    AI Customize
    Chart PPT template with bar graphs showing clicks and recipients, a pie chart for email categories, and a line graph.
    Add to Wishlist
    Download
    AI Customize
    Layered area chart with red and green segments, numeric axes, and two icons below with captions on a white background.
    Add to Wishlist
    Download
    AI Customize
    Gradient-styled horizontal bar chart with blue and green bars, labeled text areas, and a light blue background.
    Add to Wishlist
    Download
    AI Customize
    Bar chart with four vertical orange columns, gray numbered tops, captions, and a dollar sign axis on a white background.
    Free
    Add to Wishlist
    Download
    AI Customize
    Bubble chart on the right with varying circle sizes and a dark blue section on the left featuring three headings and text.
    Add to Wishlist
    Download
    AI Customize
    Dashboard layout with horizontal bar charts and circular progress indicators in green, yellow, orange, and blue.
    Add to Wishlist
    Download
    AI Customize
    Chart presentation template displaying monthly data for Visitors, New Customers, and Leads with bar and line charts.
    Add to Wishlist
    Download
    AI Customize
    Chart presentation template showing statistics for total clients, projects, and earnings with bar graphs.
    Add to Wishlist
    Download
    AI Customize
    Amazing PowerPoint Dashboard Presentation Template
    Add to Wishlist
    Download
    AI Customize
    Circular tachometer gauge with a needle pointing six colored sections, and captions in rounded rectangles connected by lines.
    Add to Wishlist
    Download
    AI Customize
    Gantt chart PowerPoint template displaying project tasks over a four week timeline with placeholder text.
    Add to Wishlist
    Download
    AI Customize
    Versatile PowerPoint Chart Templates for Data Insights
    Add to Wishlist
    Download
    AI Customize
    Horizontal bar chart with three color-coded series, labeled values, and a left side legend with numbered captions.
    Free
    Add to Wishlist
    Download
    AI Customize
    Circular gauge style infographic in shades of gray, showing a speedometer with a needle and distance markers.