Editable KPI Dashboard PowerPoint And Google Slides

Editable KPI Dashboard PowerPoint And Google Slides
P.ID : 2150
    2K+ views
    405 Downloads
    Get Custom Slides by Experts
    Instantly Access Templates in PowerPoint

    Excellent KPI Dashboard PowerPoint Slide


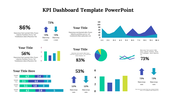
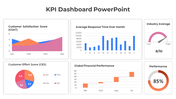
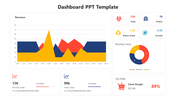
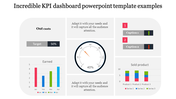
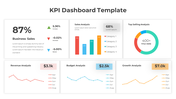
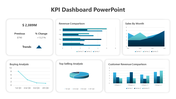
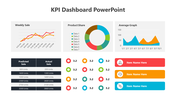
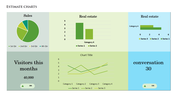
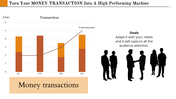
    Discover the power of data-driven decision-making with the KPI Dashboard, a robust tool simplifying performance tracking and analysis. KPI, or Key Performance Indicator, Dashboard offers a visual representation of crucial metrics vital for organizational success. By consolidating relevant data into a centralized platform, the KPI Dashboard empowers users to monitor progress towards strategic goals, identify areas for improvement, and make informed decisions. Whether evaluating sales targets, operational efficiency, or customer satisfaction, this dashboard provides invaluable insights driving optimization and success.Ideal for executives, managers, analysts, and professionals across industries, the KPI Dashboard PowerPoint template streamlines impactful presentations. With fully editable slides, users customize content to specific metrics, audience preferences, and organizational objectives. This template facilitates seamless communication of performance insights, enabling engagement with stakeholders, team alignment, and actionable outcomes. Leveraging this template, presenters streamline performance tracking, foster accountability, and accelerate progress towards strategic objectives. Empower presentations with the KPI Dashboard PPT– the key to unlocking performance excellence and achieving business success.


    Features of the template


    • 100% customizable slides and easy to download.
    • Slides are available in different nodes & colors.
    • The slide contains 16:9 and 4:3 formats.
    • Easy to change the colors of the slide quickly.
    • Highly compatible with PowerPoint and Google Slides.
    • Well-crafted template with an instant download facility.
    Advertisement

    You May Also Like These PowerPoint Templates

    Add to Wishlist
    Download
    AI Customize
    Business analysis dashboard with a bar chart and an illustrated man holding a pointer in a dark background.
    Add to Wishlist
    Download
    AI Customize
    Dashboard slide with a speedometer gauge in red, blue, yellow, and teal, and text bullet points on the left.
    Add to Wishlist
    Download
    AI Customize
    PPT template featuring a marketing dashboard with a colorful pie chart, bar graph, and progress bars for data presentation.
    Add to Wishlist
    Download
    AI Customize
    Green themed diagram illustrating stages of analysis delivery, from data source to client reports and dashboards.
    Free
    Add to Wishlist
    Download
    AI Customize
    Green bar chart PowerPoint slide with percentages for the years 2017 through 2021 and a woman standing next to the chart.
    Add to Wishlist
    Download
    AI Customize
    A slide showcasing four different chart types from Column Histogram to Scatter Plot with corresponding data.
    Add to Wishlist
    Download
    AI Customize
    Project summary dashboard showing project statistics, budget, actual performance, and project performance by category.
    Add to Wishlist
    Download
    AI Customize
    Circular gauge template with sections in red, orange, yellow, green, and dark green, with captions on either side.
    Add to Wishlist
    Download
    AI Customize
    Infographic dashboard featuring a world map with COVID-19 case data, a gender-based death rate chart, and a pie chart.
    Add to Wishlist
    Download
    AI Customize
    Sashboard design featuring three plant species data and corresponding progress meters in red, green, and blue.
    Add to Wishlist
    Download
    AI Customize
    Green circular chart with five segments labeled by categories and percentages, with descriptions around it.
    Add to Wishlist
    Download
    AI Customize
    Chart PPT template showing 4 progress circles with percentages and color coded sections for Blue, Green, Yellow, and Orange.
    Free
    Add to Wishlist
    Download
    AI Customize
    An annual sales template with sections labeled Heading 1 to 5 and a pie chart illustrating various percentages with text.
    Free
    Add to Wishlist
    Download
    AI Customize
    Executive dashboard slide with five numbered circular icons on dark blue shapes, each labeled with key principles.
    Add to Wishlist
    Download
    AI Customize
    Dashboard layout with bar, pie, and stacked charts in yellow, orange, red, and green on a white background.