Get Excellent Tachometer PPT Presentation Download

Central tachometer gauge surrounded by six numbered circles in blue, red, teal, orange, purple, and yellow, in an arc layout.
P.ID : 48935
    409 views
    34 Downloads
    Get Custom Slides by Experts
    Instantly Access Templates in PowerPoint

    Colorful Tachometer PowerPoint Presentation

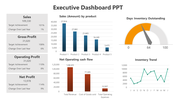
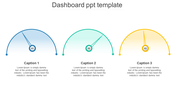
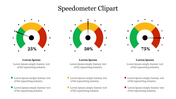
    A tachometer is a machine used to measure the rotational speed of an object to express results per minute. This template is designed in such a form with an engine measurement device with five nodes at the center. You can use the colorful degrees mentioned around the shaft to show the improving progress of your projects. You can use this template in business and company meetings to execute your gradual improvements. Download now!

    Features of the template

    • 100 % customizable slides and easy to download.
    • Slides are available in different colors
    • The slide has 4:3 and 16:9 formats.
    • Easy to change the slide colors quickly.
    • Appealing presentation to impress an audience
    • Create feature-rich slide presentations. 
    • An eye-pleasing color slide helps to give a catchy presentation.
    • Huge space to add texts independently.
    Advertisement

    You May Also Like These PowerPoint Templates

    Add to Wishlist
    Download
    AI Customize
    Slide with three tachometer dials in blue, purple, and pink, each aligned above a matching caption box.
    Add to Wishlist
    Download
    AI Customize
    Dashboard graphics displaying vehicle speeds with a data table listing vehicles, brands, and status.
    Add to Wishlist
    Download
    AI Customize
    Project dashboard slides with Gantt chart, a burndown chart, and a timeline, using a palette of brown, green, and red.
    Add to Wishlist
    Download
    AI Customize
    Tachometer PowerPoint slide with gauges indicating 10, 20, and 30 with captions for each.
    Add to Wishlist
    Download
    AI Customize
    Concentric pentagons in black with text areas around each corner, forming a simple monochrome layout.
    Add to Wishlist
    Download
    AI Customize
    Horizontal infographic with four tachometer icons in gradient colors, labeled with captions for each gauge.
    Add to Wishlist
    Download
    AI Customize
    Slide featuring a tachometer dial with four performance levels and linked captions in red, yellow, maroon, and blue.
    Add to Wishlist
    Download
    AI Customize
    Dashboard layout with charts in orange tones, including a donut chart, bar graphs, and a line chart for monthly data.
    Add to Wishlist
    Download
    AI Customize
    Slide with four red speedometers, each indicating a different percentage level, against a white background.
    Add to Wishlist
    Download
    AI Customize
    Blue themed dashboard layout with a line chart, two growth metrics, and three semi circle gauges for budget.
    Free
    Add to Wishlist
    Download
    AI Customize
    Circular speedometer with orange and gray segments, displaying kilometer markings from 5.5 KM to 8 KM.
    Free
    Add to Wishlist
    Download
    AI Customize
    Dashboard graphic featuring a circular speedometer with a red needle, surrounded by text labels for various business metrics.
    Add to Wishlist
    Download
    AI Customize
    Speedometer slide with three colorful gauges showing percentages each with captions.
    Add to Wishlist
    Download
    AI Customize
    Dashboard with a red line graph for Jan-May and a bar chart of four colored percentage bars and category icons.