Executive Dashboard PowerPoint And Google Slides

Executive dashboard slide with a colorful line chart for yearly performance.
P.ID : 3956
    1.1K+ views
    144 Downloads
    Get Custom Slides by Experts
    Instantly Access Templates in PowerPoint

    Executive Dashboard PowerPoint Template


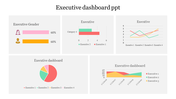
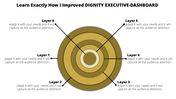
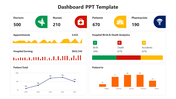
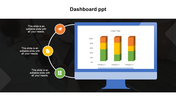
    An Executive Dashboard serves as a real-time visual representation of key performance indicators (KPIs) and critical business metrics, empowering executives to make informed decisions efficiently. This tool consolidates complex data into easily understandable visualizations, enhancing transparency and efficiency in strategic management. Executives, managers, and professionals across industries can leverage the Executive Dashboard PowerPoint template to present and analyze their organization's performance data. The template simplifies the creation of visually appealing dashboards, offering a concise and customizable way to present complex business metrics. With a range of editable slides showcasing various KPIs, charts, and graphs, this template is adaptable for organizations of varying sizes and industries. Presenters benefit from enhanced visual communication, fostering engagement and comprehension, and are encouraged to seize the potential of this template for impactful executive presentations, ensuring a strategic advantage for the organization.


    Features of this template


    • 100% customizable slides and easy to download.
    • The slide contained 16:9 and 4:3 formats.
    • Easy to change the slide colors quickly.
    • It is a well-crafted template with an instant download facility.
    • Highly compatible with PowerPoint and Google Slides.
    Advertisement

    You May Also Like These PowerPoint Templates

    Free
    Add to Wishlist
    Download
    AI Customize
    PowerPoint slide with a project dashboard showing two speedometers to represent project progress with captions.
    Add to Wishlist
    Download
    AI Customize
    KPI dashboard with bar graphs showing data trends over time and two green summary boxes.
    Free
    Add to Wishlist
    Download
    AI Customize
    Dashboard PPT template featuring a speedometer with labeled sections like Direction, Objectives, Data, Business, and Study.
    Add to Wishlist
    Download
    AI Customize
    Vehicle dashboard slide featuring a speedometer on the left and a detailed table on the right with its brands.
    Add to Wishlist
    Download
    AI Customize
    KPI template showing a bar chart with four cases, and two circular progress indicators in blue and orange showing percentage.
    Add to Wishlist
    Download
    AI Customize
    A slide displaying dashboard elements like bar graphs, a world map with data points, and progress bars, with captions.
    Add to Wishlist
    Download
    AI Customize
    Marketing KPI dashboard comparing Google, Facebook, and Bing ads, featuring clicks, cost, line charts, and campaign analysis.
    Add to Wishlist
    Download
    AI Customize
    Slide with multiple charts including bar, line, and pie charts illustrating data for hires, turnover, and training.
    Add to Wishlist
    Download
    AI Customize
    Orange speedometer slide with a gauge showing 70% progress and space for caption text below.
    Free
    Add to Wishlist
    Download
    AI Customize
    Visual of project phases and value generation over time, with milestones labeled as planning, detailing, and implementation.
    Free
    Add to Wishlist
    Download
    AI Customize
    Tachometer PowerPoint slide featuring a colorful gauge with segments labeled with space for captions on a white backdrop.
    Add to Wishlist
    Download
    AI Customize
    Business slide with four sections representing different concepts Equality, Human Rights, Independent, and Multi Party.
    Add to Wishlist
    Download
    AI Customize
    Executive dashboard with a pie chart, vertical and horizontal bar graph, and a waterfall chart, displaying various data.
    Add to Wishlist
    Download
    AI Customize
    Dashboard slide with metrics for social media, including followers, engagement, impressions, and reviews in charts.
    Add to Wishlist
    Download
    AI Customize
    Executive dashboard slide displaying colorful charts for executing dashboard to quality.
    Add to Wishlist
    Download
    AI Customize
    Business dashboard featuring a profile card, three financial metrics, a 67% circular chart, and a dual-colored area graph.
    Add to Wishlist
    Download
    AI Customize
    KPI PPT slide featuring circular progress indicators and a table of data values with captions on a white backdrop.