Free - Usable Dashboard PowerPoint And Google Slides Template

Free
Dashboard with line chart for appointments, bar chart from hospital earnings to patient totals, and intake by category.
P.ID : 41689
    694 views
    235 Downloads
    Get Custom Slides by Experts
    Instantly Access Templates in PowerPoint

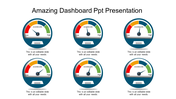
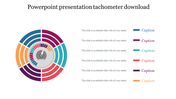
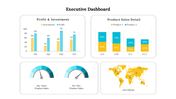
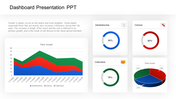
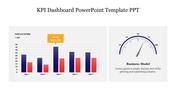
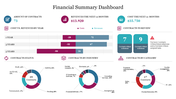
    Dashboard PowerPoint Slide


    Transform your data into actionable insights with our dashboard PPT template. Designed to simplify complex information and provide a clear overview of key metrics, this template is an indispensable tool for professionals across various industries. Each slide is meticulously crafted to offer valuable content that helps you track performance, identify trends, and make informed decisions. With 100% editable and customizable elements, you can easily tailor the dashboard to meet your specific needs. Empower your presentations and elevate your data analysis capabilities with ease. Download this dashboard PPT template today and unlock the full potential of your data-driven strategies. With its user-friendly features and professional design, this template is your gateway to creating impactful dashboards that drive results. Don't wait download this template today and take your presentations to the next level!

    Features of this template


    • 100% customizable slides and easy to download.
    • The slide contains 16:9 and 4:3 formats.
    • Easy to change the colors of the slide quickly.
    • Highly compatible with PowerPoint and Google Slides.
    Advertisement

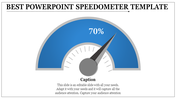
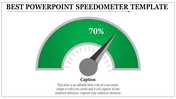
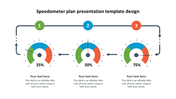
    You May Also Like These PowerPoint Templates

    Add to Wishlist
    Download
    AI Customize
    KPI Dashboard PPT slide displaying project analysis, revenue, profitability, and gap analysis with data visualizations.
    Add to Wishlist
    Download
    AI Customize
    Business KPI dashboard showcasing charts for real estate and page views with pie, bar, and line graph visualizations.
    Add to Wishlist
    Download
    AI Customize
    Executive dashboard slide displaying many charts from new business to operational expenses.
    Add to Wishlist
    Download
    AI Customize
    Colorful infographic with a line graph, pie and bar chart, and numerical data panels in a structured KPI template design.
    Add to Wishlist
    Download
    AI Customize
    Dashboard template showing sales, orders, visitors, and users metrics with visual bar and pie charts for website analysis.
    Add to Wishlist
    Download
    AI Customize
    Dashboard template with a semi-circular gauge indicating performance with a blurred image and caption areas.
    Add to Wishlist
    Download
    AI Customize
    Dashboard slide showing plant growth data with details table and area chart for Zantedeschia, Celosia, and Calendula.
    Add to Wishlist
    Download
    AI Customize
    Project overview dashboard template with area chart, line charts for time intervals, and percentage indicators.
    Add to Wishlist
    Download
    AI Customize
    Colorful Tachometer slide with color coded sections from light to BMI with placeholder text.
    Add to Wishlist
    Download
    AI Customize
    Slide with three tachometer dials in blue, purple, and pink, each aligned above a matching caption box.
    Add to Wishlist
    Download
    AI Customize
    Dashboard graphics displaying vehicle speeds with a data table listing vehicles, brands, and status.
    Add to Wishlist
    Download
    AI Customize
    Project dashboard slides with Gantt chart, a burndown chart, and a timeline, using a palette of brown, green, and red.
    Add to Wishlist
    Download
    AI Customize
    Tachometer PowerPoint slide with gauges indicating 10, 20, and 30 with captions for each.
    Free
    Add to Wishlist
    Download
    AI Customize
    Dashboard with a timeline bar chart in green and purple, labeled with milestones for savings and investments.
    Add to Wishlist
    Download
    AI Customize
    Dashboard showing from defect rate trends upto delivery time analysis in mixed orange and brown theme.
    Add to Wishlist
    Download
    AI Customize
    KPI slide with four semi circular gauges displaying metrics and overlapping colored circles showing numerical data.