Slidea Logo
Try it now — the new, easy way to turn your slides into an interactive experience.
Explore Now

Free - Social Media Dashboard PowerPoint And Google Slides

Free
Pack of 13 slides
P.ID : 76851
Advertisement
1 views
1 Downloads
Get Custom Slides by Experts
Enhance Your Presentations with Add-ins
Google Slides Add-in
Access templates directly in Google Slides
Microsoft PowerPoint Add-in
Access templates directly in PowerPoint
GPT Add-on
AI-powered presentation assistance

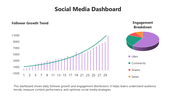
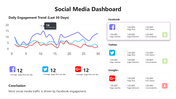
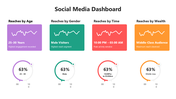
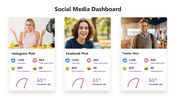
Social Media Dashboard PowerPoint, Google Slides, and Canva Template


The Social Media Dashboard template is designed to help businesses and marketers track, analyze, and present social media performance in a clear and visual way. This dashboard brings all key metrics—such as engagement, profile visits, content reach, follower growth, and audience distribution—into one easy-to-understand layout.

With well-structured charts, graphs, and performance indicators, this template makes it simple to monitor trends, compare platform performance, and understand audience behavior. It is ideal for presenting monthly reports, campaign results, and growth insights without overwhelming your audience with raw data.


The dashboard includes sections for engagement trends, audience breakdowns, platform comparisons, and post-level performance. These visuals help turn numbers into insights, making it easier to identify what content works, which platforms perform best, and where improvements are needed.


This template is especially useful for
digital marketers, social media managers, content creators, agencies, startups, and business teams who want to communicate performance clearly and professionally. It also works well for internal reviews, client presentations, and strategy meetings.


All slides are fully editable, allowing you to customize charts, colors, text, and data to match your brand or reporting needs. The design is modern, clean, and professional, and it works smoothly with
PowerPoint, Google Slides, and Canva, giving you flexibility across platforms.


Use this Social Media Dashboard template to present high-impact social media insights, support data-driven decisions, and showcase performance with confidence.

Features of this template

  • 100% customizable slides and easy to download.
  • The slides contain 16:9 and 4:3 formats.
  • Easy to change the colors quickly.
  • Highly compatible with PowerPoint, Google Slides, and Canva templates.

You May Also Like These PowerPoint Templates

Add to Wishlist
Download
AI Customize
KPI themed slide with data visualization including pie charts, bar graphs, line graphs, and key metrics.
Add to Wishlist
Download
AI Customize
Concentric pentagons in black with text areas around each corner, forming a simple monochrome layout.
Add to Wishlist
Download
AI Customize
KPI PowerPoint slide featuring three colored gauges for Revenue, Sales, and Sales Value with respective values.
Add to Wishlist
Download
AI Customize
Logistics performance dashboard with two circular charts for failure distribution and delivery tracking, and a gauge meter.
Add to Wishlist
Download
AI Customize
Template displaying a structured flowchart for KPI types, categorized into qualitative and quantitative evaluations.
Add to Wishlist
Download
AI Customize
Botanical data dashboard template  showing performance metrics for flower species, featuring line and bar charts.
Free
Add to Wishlist
Download
AI Customize
PowerPoint slide with a project dashboard showing two speedometers to represent project progress with captions.
Free
Add to Wishlist
Download
AI Customize
Pie chart in orange, red, green, and blue sections with two text labels on either side, highlighting sales performance.
Free
Add to Wishlist
Download
AI Customize
Five-level bar chart executive dashboard with colored blocks labeled with five levels, showing a gradual progression.
Free
Add to Wishlist
Download
AI Customize
Business slide featuring a circular layout with four orange sections and icons representing key aspects of business.
Add to Wishlist
Download
AI Customize
KPI dashboard template PowerPoint slide featuring three sections for data visualization.
Add to Wishlist
Download
AI Customize
Slide with a businesswoman standing beside a colorful ring chart labeled on a board and four captions on the right.
Add to Wishlist
Download
AI Customize
KPI template displaying financial metrics, including sales, profitability, liquidity, and leverage, with two gauge charts.
Add to Wishlist
Download
AI Customize
KPI dashboard template with six sections which includes charts, graphs, and numerical data.
Add to Wishlist
Download
AI Customize
Project summary dashboard showing project statistics, budget, actual performance, and project performance by category.
Add to Wishlist
Download
AI Customize
Four colored circular progress, one is higlighted in a box with a pie chart, and a bar chart labelled with sections.