Comprehensive Logistics PPT Template for Supply Chains

Logistics performance dashboard with two circular charts for failure distribution and delivery tracking, and a gauge meter.
P.ID : 34400
    11 slides
    Slide deck of energy dashboards displaying data visualizations like pie charts, bar and line graphs, in green shades.
    36 slides
    KPI infographic slide deck, combining line and bar graphs,  pie charts, and performance dials for data representation.
    36 slides
    A collection of isometric KPI infographic slides showcasing bar graphs, pie charts, and performance metrics with icons.
    280 views
    16 Downloads
    Get Custom Slides by Experts
    Instantly Access Templates in PowerPoint

    Logistics PowerPoint Template and Google Slides


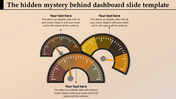
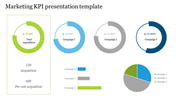
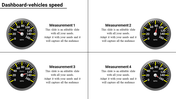
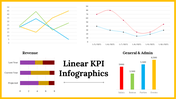
    Streamline your logistics presentations with our comprehensive template. Designed with efficiency in mind, it features detailed analytics and specific charts tailored to measure delivery quantity and time, among other essential metrics.

    Navigate your logistics data effortlessly with our intuitive charting system, providing insights into performance, efficiency, and areas for improvement. Whether you're analyzing delivery timelines, inventory levels, or transportation routes, our template offers clarity and precision.

    Empower your audience with actionable insights and strategic recommendations derived from robust analytics. Visualize complex logistics data in a clear and concise manner, fostering understanding and informed decision-making.

    Ideal for logistics professionals, supply chain managers, and transportation experts, our template ensures your message resonates with impact and authority. Download the Logistics PowerPoint Template and Google Slides today, and revolutionize your logistics presentations with data-driven clarity.

    Features of the template

    • 100% customizable slides and easy to download.
    • Slides are available in different nodes & colors.
    • The slide contains 16:9 and 4:3 formats.
    • It is easy to change the colors of the slide quickly. 
    • Well-crafted template with an instant download facility.
    Advertisement

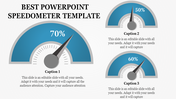
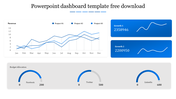
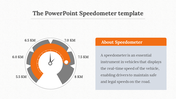
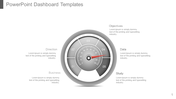
    You May Also Like These PowerPoint Templates

    Add to Wishlist
    Download
    AI Customize
    KPI dashboard featuring financial data with profit trends and metrics visualized through charts and dials.
    Free
    Add to Wishlist
    Download
    AI Customize
    Dashboard template with five numbered columns and placeholders text areas in different shades of grey theme.
    Add to Wishlist
    Download
    AI Customize
    PowerPoint speedometer template featuring three speed gauges.
    Add to Wishlist
    Download
    AI Customize
    Circular tachometer divided into four sections  in blue, red, purple, and teal, featuring transport icons and captions.
    Add to Wishlist
    Download
    AI Customize
    Dashboard PowerPoint template featuring three speedometer graphics labeled with captions.
    Add to Wishlist
    Download
    AI Customize
    Attractive Tachometer Presentation Template Designs
    Add to Wishlist
    Download
    AI Customize
    Attractive Tachometer PowerPoint Presentation Template
    Add to Wishlist
    Download
    AI Customize
    PowerPoint dashboard template displaying Employee Net Promoter Score with a gauge and two emojis.
    Add to Wishlist
    Download
    AI Customize
    Vector illustration of a speedometer with colored section on a conveyor belt with placeholder text.
    Add to Wishlist
    Download
    AI Customize
    Dashboard PPT slide with three colorful speedometers representing varying performance levels on a black background.
    Add to Wishlist
    Download
    AI Customize
    Three circular tachometer dials in blue, pink, and red, each displaying different percentage values with captions below.
    Add to Wishlist
    Download
    AI Customize
    Slide with two speedometer style gauge charts in green, red, and purple segments, displaying percentages.
    Add to Wishlist
    Download
    AI Customize
    Dashboard template with a world map showing highlighted regions, bar graphs, and financial data captions.
    Add to Wishlist
    Download
    AI Customize
    Three colored tachometer gauges in red, orange, and green, each paired with a caption areas beneath.
    Add to Wishlist
    Download
    AI Customize
    Yellow speedometer design with two semicircular gauges displaying percentages, each paired with captions.
    Add to Wishlist
    Download
    AI Customize
    Tachometer PowerPoint template with four stages featuring colorful gauges and caption areas on a white backdrop.