Free - Speedometer PowerPoint Template and Google Slides
Free

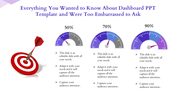

Speedometer PowerPoint Template and Google Slides
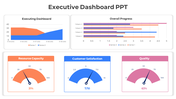
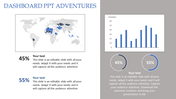
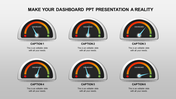
Get your presentation into high gear with our Speedometer PowerPoint Template and Google Slides. This dynamic template features a sleek speedometer design with a needle pointing to the speed levels.
The template offers ample space for your text in rectangular boxes placed strategically around the speedometer. With a crisp white background, your content will stand out clearly, ensuring maximum visibility and impact.
Whether you're discussing performance metrics, project progress, or business goals, this template provides a visually engaging way to convey information about speed, progress, and efficiency. Impress your audience with a presentation that drives your message home effectively.
Features of the template
- 100% customizable slides and easy to download.
- Slides are available in different nodes & colors.
- The slide contains 16:9 and 4:3 formats.
- It is easy to change the colors of the slide quickly.
- Well-crafted template with an instant download facility.


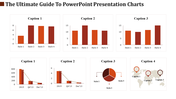
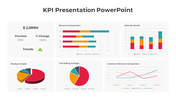
You May Also Like These PowerPoint Templates
Add to Wishlist
Download
AI Customize

Add to Wishlist
Download
AI Customize

Add to Wishlist
Download
AI Customize

Add to Wishlist
Download
AI Customize


Add to Wishlist
Download
AI Customize

Add to Wishlist
Download
AI Customize

Add to Wishlist
Download
AI Customize

Add to Wishlist
Download
AI Customize

Add to Wishlist
Download
AI Customize

Add to Wishlist
Download
AI Customize

Add to Wishlist
Download
AI Customize


Add to Wishlist
Download
AI Customize

Add to Wishlist
Download
AI Customize

Add to Wishlist
Download
AI Customize


Add to Wishlist
Download
AI Customize

Add to Wishlist
Download
AI Customize
