Attractive KPI PowerPoint And Google Slides Template

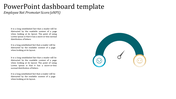
KPI PowerPoint Template
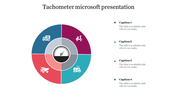
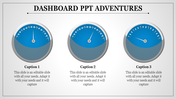
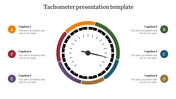
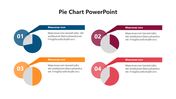
Our KPI PowerPoint Template helps to bring out the strategic performance of data. The personal computer serves as the focal point, strategically integrating with the presentation. The graphical representations on the computer screen add a dynamic layer to your KPI presentation. The Four Chart provide a way to grasp KPI values. Precision in meter design ensures that complex metrics are communicated with clarity, making it accessible for all levels of audience understanding. Perfect for executives, analysts, and performance-driven teams.It breaks down key performing factors into digestible components and empowers presenters to communicate complex performance metrics with ease. It serves as a unique tool for anyone looking to present, analyze, and discuss key performance indicators.
Features of the Template
- 100% customizable slides and easy to download.
- Slides are available in different nodes & colors.
- The slide contained 16:9 and 4:3 formats.
- Easy to change the slide colors quickly.
- It is a well-crafted template with an instant download facility.


You May Also Like These PowerPoint Templates
Add to Wishlist
Download
AI Customize

Add to Wishlist
Download
AI Customize

Add to Wishlist
Download
AI Customize

Add to Wishlist
Download
AI Customize

Add to Wishlist
Download
AI Customize

Add to Wishlist
Download
AI Customize

Add to Wishlist
Download
AI Customize

Add to Wishlist
Download
AI Customize

Add to Wishlist
Download
AI Customize

Add to Wishlist
Download
AI Customize

Add to Wishlist
Download
AI Customize

Add to Wishlist
Download
AI Customize

Add to Wishlist
Download
AI Customize

Add to Wishlist
Download
AI Customize

Add to Wishlist
Download
AI Customize

Add to Wishlist
Download
AI Customize

Add to Wishlist
Download
AI Customize

Add to Wishlist
Download
AI Customize

Add to Wishlist
Download
AI Customize

Add to Wishlist
Download
AI Customize
