Project KPI Dashboard PowerPoint And Google Slides

KPI Dashboard PPT slide displaying project analysis, revenue, profitability, and gap analysis with data visualizations.
P.ID : 2125
    1.7K+ views
    122 Downloads
    Get Custom Slides by Experts
    Instantly Access Templates in PowerPoint

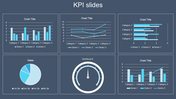
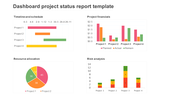
    KPI Dashboard PowerPoint Template 


    Discover the potential of data-driven decision-making with the KPI Dashboard, a robust tool designed to simplify performance tracking and analysis.KPI, or Key Performance Indicator, Dashboard offers a visual representation of key metrics critical to organizational success. By consolidating relevant data into one centralized platform, the KPI Dashboard empowers users to monitor progress towards strategic goals, identify areas for improvement, and make informed decisions. From assessing sales targets to evaluating operational efficiency and customer satisfaction, this dashboard provides valuable insights that drive optimization and success.Tailored for business executives, managers, analysts, and professionals across industries, the KPI Dashboard PowerPoint template streamlines the creation of impactful presentations. Featuring fully editable slides, users can customize content to suit specific metrics, audience preferences, and organizational objectives. This template facilitates seamless communication of performance insights, enabling presenters to engage stakeholders, align teams, and drive actionable outcomes. By leveraging this template, presenters can streamline performance tracking processes, foster a culture of accountability, and accelerate progress towards strategic objectives. Empower your presentations with the KPI Dashboard PowerPoint– your key to unlocking performance excellence and achieving business success.


    Features of this template


    • 100% customizable slides and easy to download.
    • Slides are available in different nodes & colors.
    • The slide contains 16:9 and 4:3 formats.
    • Easy to change the colors of the slide quickly.
    • Highly compatible with PowerPoint and Google Slides.
    • Well-crafted template with an instant download facility.
    Advertisement

    You May Also Like These PowerPoint Templates

    Add to Wishlist
    Download
    AI Customize
    Three speedometers showing progress percentages: 25%, 50%, and 75%, with gradient colors in yellow, orange, and red.
    Add to Wishlist
    Download
    AI Customize
    Colorful pie chart with four segments in blue, purple, red, and orange, with matching text boxes showing percentages.
    Add to Wishlist
    Download
    AI Customize
    Online marketing dashboard slide showing graphs for TV Media, Facebook, Direct Marketing, and YouTube performance.
    Add to Wishlist
    Download
    AI Customize
    Metrics Dashboard PowerPoint Template & Google Slides
    Free
    Add to Wishlist
    Download
    AI Customize
    Slide with three gauge meters in orange, yellow, and gray, each paired with a table for KPI metrics.
    Free
    Add to Wishlist
    Download
    AI Customize
    KPI presentation template displaying colorful charts for revenue, units sold, and product category analysis.
    Free
    Add to Wishlist
    Download
    AI Customize
    Effective Project Dashboard PowerPoint Presentation
    Free
    Add to Wishlist
    Download
    AI Customize
    Project management dashboard slide showing various tasks in planning, design with workload, and budget charts.
    Add to Wishlist
    Download
    AI Customize
    Speedometer clipart slide featuring three gauges at 25%, 50%, and 75% with space for descriptive text below each.
    Free
    Add to Wishlist
    Download
    AI Customize
    KPI slide displaying key performance indicators with many sections and accompanying data charts.
    Add to Wishlist
    Download
    AI Customize
    Dashboard slide showcasing project management KPIs with bar graphs, a line graph, and a pie chart in different colors.
    Add to Wishlist
    Download
    AI Customize
    Project management dashboard with charts for budget, progress, risks, workload, and projected launch date and icons.
    Add to Wishlist
    Download
    AI Customize
    PowerPoint slide with KPI dashboard metrics, including revenue, sales by month, and customer revenue comparison.
    Free
    Add to Wishlist
    Download
    AI Customize
    KPI Dashboard with bubbles for sales, attendance, download, and report and a client location legend.
    Add to Wishlist
    Download
    AI Customize
    KPI Training slide featuring a social media analysis table with metrics for followers, mentions, interactions, and shares.
    Add to Wishlist
    Download
    AI Customize
    Task management dashboard slide showing task numbers and completion percentages with colored gauge icons.
    Add to Wishlist
    Download
    AI Customize
    Revenue dashboard with bar charts, statistics, and sliders showing data metrics in various colors.
    Add to Wishlist
    Download
    AI Customize
    Editable Speedometer PowerPoint Template Presentation