MILESTONE 🌟 5 Million+ creative minds trust SlideEgg! Grab 80% OFF

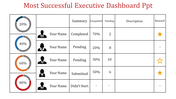
Free - Customizable KPI Dashboard PowerPoint

Free
KPI Dashboard with bubbles for sales, attendance, download, and report and a client location legend.
P.ID : 66128
    845 views
    118 Downloads
    Get Custom Slides by Experts
    Instantly Access Templates in PowerPoint

    Relate Many Themes Using This Template


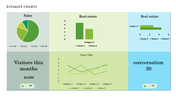
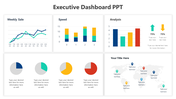
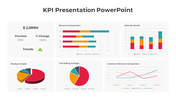
    This free customizable KPI Dashboard PowerPoint template is designed to present your key metrics across a variety of business and productivity topics in a comprehensive and visually appealing way. By presenting your data clearly and concisely, you can make informed decisions, track progress, and effectively communicate performance with your team.

    Highlights of this template:


    • Focused visualization: Displays your key KPIs in one place, making it easy to understand overall performance.
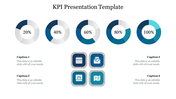
    • Colorful and eye-catching design: Colorful elements in a circular shape attract the attention of viewers and help them easily identify information.
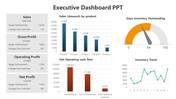
    • Customizable elements: Each element in the chart can be customized to suit your specific data and brand. Colors, labels, and data points can be modified.
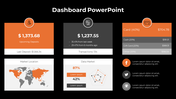
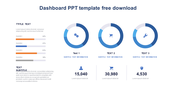
    • Useful tool for presenting a variety of data points: It is suitable for presenting a variety of data points, such as sales, downloads, visits, and reports.
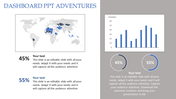
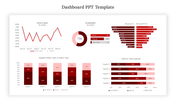
    • Easy-to-understand charts: Visual elements such as pie charts present complex data in a simple and understandable format.
    • Detailed information presentation: Each KPI is clearly displayed with related statistics, allowing for in-depth analysis of performance.
    • Suitable for a variety of applications: Can be used for business reports, performance evaluations, project progress reports, and more.

    Features of the Template

    • 100% customizable slides and easy to download
    • Slides are available in different nodes & colors.
    • The slides contained 16:9 and 4:3 formats.
    • Easy to change the slide colors quickly.
    • Well-crafted Template with an instant download facility.
    • Crisp and elegant font style. 
    • The best Template with attractive nodes.
    Advertisement

    You May Also Like These PowerPoint Templates

    Free
    Add to Wishlist
    Download
    AI Customize
    Bar chart comparing increases and decreases for movies like Avatar and Aquaman, with title logos below.
    Add to Wishlist
    Download
    AI Customize
    Dashboard PPT template with three colored gauges showing 30, 60, and 90 percent completion with captions.
    Add to Wishlist
    Download
    AI Customize
    KPI PowerPoint template with a gauge and table for displaying yearly financial data on a white backdrop.
    Add to Wishlist
    Download
    AI Customize
    Speedometer dashboard PowerPoint slides showing three colored gauges with 25, 50, and 75 percent progress with captions.
    Add to Wishlist
    Download
    AI Customize
    Dashboard PPT slide showcasing defect rates, supplier analysis, revenue breakdown, and delivery time analysis with charts.
    Add to Wishlist
    Download
    AI Customize
    KPI PowerPoint slide featuring three colored gauges for Revenue, Sales, and Sales Value with respective values.
    Add to Wishlist
    Download
    AI Customize
    KPI dashboard template with bar and line graphs showing private school growth for 2017, 2018, and 2019 with educational data.
    Free
    Add to Wishlist
    Download
    AI Customize
    Free KPI Presentation PPT Template and Google Slides
    Add to Wishlist
    Download
    AI Customize
    Executive Dashboard slide showing key performance metrics such as revenue vs. target, customer acquisition, and CAC vs. CLV.
    Free
    Add to Wishlist
    Download
    AI Customize
    Dashboard template with a circular speedometer gauge in the center, divided into five blue segments labeled 01 to 05.
    Free
    Add to Wishlist
    Download
    AI Customize
    Colorful project dashboard PPT slide showing a bar chart for four sections with a pie chart detailing percentages.
    Add to Wishlist
    Download
    AI Customize
    KPI slide displaying a financial table for FY 2018, with figures for Net Sales, Income, and Expenses for each quarter.
    Add to Wishlist
    Download
    AI Customize
    Data driven financial presentation slide featuring revenue, profit, and customer metrics, along with trend graphs.
    Free
    Add to Wishlist
    Download
    AI Customize
    KPI dashboard bar chart slide representing the height of the world's tallest hills with a world map marking their locations.
    Free
    Add to Wishlist
    Download
    AI Customize
    Dashboard infographic with three gauge meters in blue, green, and yellow, each labeled with a number and caption.
    Add to Wishlist
    Download
    AI Customize
    KPI dashboard slide with line chart, showing performance for four categories, along with circular percentage indicators.