Incredible KPI Presentation PowerPoint Template Design

Sales KPI PPT slide featuring charts for Revenue, Revenue Comparison, New Customers, and Customer Acquisition Cost CAS.
P.ID : 34104
    948 views
    58 Downloads
    Get Custom Slides by Experts
    Instantly Access Templates in PowerPoint

    Best KPI Presentation Slide

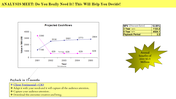
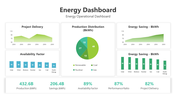
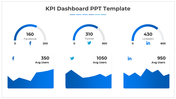
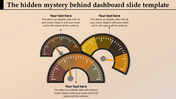
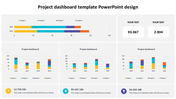
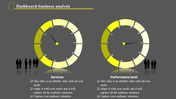
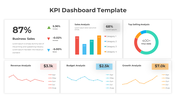
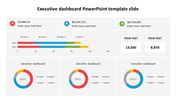
    KPI (Key Performance Indicator) is a process or way to assess the success of an important activity that takes place within an organization. It helps to measure the values and helps us focus on the desired result. Mainly KPIs are involved in giving the overall performance of a business process. To present a detailed study of KPI and its process, you can opt for this creative KPI presentation template from SlideEgg. We have designed it to be accessible with a striking bar diagram, pictures, and nodes. Try Now! They are free to customize.

    Features of the template

    • 100% customizable slides and easy to download.
    • Slides are available in different nodes & colors.
    • The slide contained 16:9 and 4:3 formats.
    • Easy to change the slide colors quickly.
    • It is a well-crafted template with an instant download facility.
    • Mind-blowing slide for the presentation.
    • Creative KPI theme slide.
    Advertisement

    You May Also Like These PowerPoint Templates

    Add to Wishlist
    Download
    AI Customize
    Four colored circular progress, one is higlighted in a box with a pie chart, and a bar chart labelled with sections.
    Add to Wishlist
    Download
    AI Customize
    Key performance indicator slide displaying data bars, percentages, and distinct icons in a structured layout.
    Add to Wishlist
    Download
    AI Customize
    Comprehensive program dashboard featuring charts and gauges for quality, budget, risks, overall project map, progress, and resource updates.
    Free
    Add to Wishlist
    Download
    AI Customize
    Four black speedometers with white numbers and yellow markers arranged in a two by two grid with descriptions.
    Add to Wishlist
    Download
    AI Customize
    KPI infographic slide deck, combining line and bar graphs,  pie charts, and performance dials for data representation.
    Add to Wishlist
    Download
    AI Customize
    Semi circular gauge in shades of brown and peach with a pointer, alongside text and a silhouette group at the bottom.
    Free
    Add to Wishlist
    Download
    AI Customize
    An executive dashboard showing income and expense distribution, with key financial metrics and a line graph.
    Add to Wishlist
    Download
    AI Customize
    Semi circular gauge with six color coded sections from green to red, With numbers 01 to 06, labeled KPI at the bottom.
    Add to Wishlist
    Download
    AI Customize
    A collection of isometric KPI infographic slides showcasing bar graphs, pie charts, and performance metrics with icons.
    Add to Wishlist
    Download
    AI Customize
    Slide with blue stats on the left and various charts, including bar and pie charts in different colors.
    Add to Wishlist
    Download
    AI Customize
    Comprehensive project dashboard template with progress charts, data bars, and financial performance indicators.
    Add to Wishlist
    Download
    AI Customize
    KPI dashboard featuring financial data with profit trends and metrics visualized through charts and dials.
    Add to Wishlist
    Download
    AI Customize
    KPI Dashboard slide displaying metrics with bar charts and line graphs for key business indicators.
    Add to Wishlist
    Download
    AI Customize
    PowerPoint speedometer template featuring three speed gauges.
    Add to Wishlist
    Download
    AI Customize
    Circular tachometer divided into four sections  in blue, red, purple, and teal, featuring transport icons and captions.