KPI Presentation PowerPoint Slide Templates

Dashboard-themed slide with semi-circle charts for business analysis, featuring metrics and reflective silhouettes at the bottom.
P.ID : 1831
    1.2K+ views
    79 Downloads
    Get Custom Slides by Experts
    Instantly Access Templates in PowerPoint

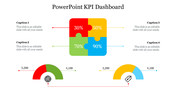
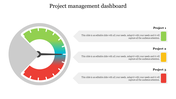
    KPI Dashboard Presentation Template


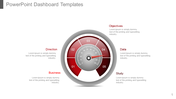
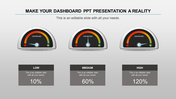
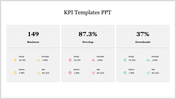
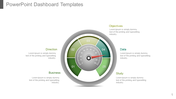
    Try our KPI PowerPoint template to transform your presentations and easily translate complex data into understandable ideas. Easily navigate your business analysis dashboard, where services and performance measures are presented in a clear, attractive style. This carefully crafted template guarantees deep knowledge in addition to presenting vital performance measurements.

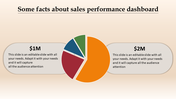
    This presentation, which is specifically designed for managers, analysts, and executives, becomes the keystone for making strategic decisions. Whether monitoring sales success or assessing project milestones, our KPI template easily condenses data into meaningful insights. It remains an important tool for professionals who want to use data-driven communication in the future to impress audiences and improve their presentations.


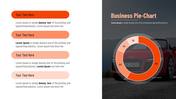
    Features of the template include complete adaptability, compatibility with 4:3 and 16:9 aspect ratios in zip format, strong connectivity with Google Slides and PowerPoint, and easy color customization. Moreover, the icons are carefully designed to resonate with your vision, adding a specific and meaningful touch to your presentation.


    Supercharge your presentations with our KPI Presentation PowerPoint template! Take the next step in professional communication by downloading it now. Simplify complex information with ease and hold the attention of your audience. Increase your effect by clicking the button that turns data into wisdom!

    Advertisement

    You May Also Like These PowerPoint Templates

    Add to Wishlist
    Download
    AI Customize
    Colorful dashboard PPT slide with world map, pie charts, bar graphs, and metrics with placeholder text.
    Free
    Add to Wishlist
    Download
    AI Customize
    Dashboard template with three colorful gauge icons in the center and text boxes in green, blue, and gold.
    Free
    Add to Wishlist
    Download
    AI Customize
    PowerPoint slide with a project dashboard showing two speedometers to represent project progress with captions.
    Free
    Add to Wishlist
    Download
    AI Customize
    Dashboard PPT template featuring a speedometer with labeled sections like Direction, Objectives, Data, Business, and Study.
    Add to Wishlist
    Download
    AI Customize
    KPI template showing a bar chart with four cases, and two circular progress indicators in blue and orange showing percentage.
    Add to Wishlist
    Download
    AI Customize
    A slide displaying dashboard elements like bar graphs, a world map with data points, and progress bars, with captions.
    Add to Wishlist
    Download
    AI Customize
    Marketing KPI dashboard comparing Google, Facebook, and Bing ads, featuring clicks, cost, line charts, and campaign analysis.
    Add to Wishlist
    Download
    AI Customize
    Orange speedometer slide with a gauge showing 70% progress and space for caption text below.
    Free
    Add to Wishlist
    Download
    AI Customize
    Tachometer PowerPoint slide featuring a colorful gauge with segments labeled with space for captions on a white backdrop.
    Add to Wishlist
    Download
    AI Customize
    Dashboard slide with metrics for social media, including followers, engagement, impressions, and reviews in charts.
    Add to Wishlist
    Download
    AI Customize
    Executive dashboard slide displaying colorful charts for executing dashboard to quality.
    Add to Wishlist
    Download
    AI Customize
    KPI PPT slide featuring circular progress indicators and a table of data values with captions on a white backdrop.
    Add to Wishlist
    Download
    AI Customize
    Sales KPI PPT slide featuring charts for Revenue, Revenue Comparison, New Customers, and Customer Acquisition Cost CAS.
    Free
    Add to Wishlist
    Download
    AI Customize
    Dashboard slide with a world map highlighting countries, a bar chart showing statistics, and two percentage indicators.
    Free
    Add to Wishlist
    Download
    AI Customize
    Five-level bar chart executive dashboard with colored blocks labeled with five levels, showing a gradual progression.