Free - Inventive PowerPoint Dashboard Templates Presentation

Free
Dashboard PPT template featuring a speedometer with labeled sections like Direction, Objectives, Data, Business, and Study.
P.ID : 35768
    439 views
    194 Downloads
    Get Custom Slides by Experts
    Instantly Access Templates in PowerPoint

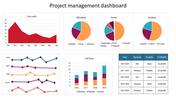
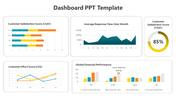
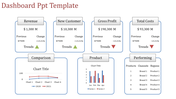
    Dashboard PowerPoint Template and Google Slides Themes


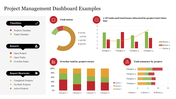
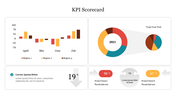
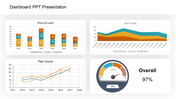
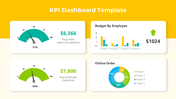
    Experience the next evolution in presentation prowess with our free Dashboard PowerPoint Template and Google Slides themes. Crafted to propel your message with precision, this template boasts five intricately designed nodes: objectives, data, study, business, and direction. Seamlessly navigate your narrative with a user-friendly dashboard interface, effortlessly guiding your audience through each pivotal point. Engage with captivating captions, personalize title holders, and enrich your discourse with expansive text areas. Tailored for professionals spanning diverse sectors, from corporate trailblazers to academic influencers, this template empowers you to articulate your vision with clarity and finesse. Transform raw data into compelling stories, dissect critical insights, and steer your stakeholders towards collective success. Elevate your presentations with our Dashboard Presentation, where innovation meets impact. Redefine your narrative today.

    Features of the Template

    • 100 % customizable slides.
    • The slide show is in 4:3, 16:9, zip format.
    • There is powerful connectivity with Google Slides and PowerPoint.
    • It is simple and quick to alter the slide's color.
    • An efficient template that can be easily accessed immediately.
    • Well-crafted template with an instant download facility.
    Advertisement

    You May Also Like These PowerPoint Templates

    Add to Wishlist
    Download
    AI Customize
    Semi circular meter template with green, lime, yellow, and red sections, each displaying thumbs up icons, and text.
    Free
    Add to Wishlist
    Download
    AI Customize
    KPI dashboard with a data table on the left and a circular chart on the right, featuring shades of teal and white.
    Free
    Add to Wishlist
    Download
    AI Customize
    Effective Speedometer PowerPoint Template Presentation
    Add to Wishlist
    Download
    AI Customize
    KPI themed slide with data visualization including pie charts, bar graphs, line graphs, and key metrics.
    Add to Wishlist
    Download
    AI Customize
    Executive dashboard with a portfolio summary table listing project details and a pie chart displaying a quarterly report.
    Add to Wishlist
    Download
    AI Customize
    Six semicircular gauges with colored indicators in red, purple, blue, yellow, pink, and green on a white backdrop.
    Add to Wishlist
    Download
    AI Customize
    Dashboard template showing main categories, team metrics, and performance details with various visual elements.
    Free
    Add to Wishlist
    Download
    AI Customize
    Slide showcasing three different types of colored charts an area chart, a bar chart, and a line chart, with captions below.
    Add to Wishlist
    Download
    AI Customize
    Tachometer slide featuring a dial with a needle pointing to colored segments and four caption areas.
    Add to Wishlist
    Download
    AI Customize
    Set of three speedometer gauges indicating 70%, 50%, and 55%, with placeholder text areas placed in a white backdrop.
    Add to Wishlist
    Download
    AI Customize
    Central black speedometer with four surrounding colored icons, each detailing various aspects of kilometers.
    Add to Wishlist
    Download
    AI Customize
    Awesome Dashboard PPT Template Free Download Slides
    Add to Wishlist
    Download
    AI Customize
    Template displaying a structured flowchart for KPI types, categorized into qualitative and quantitative evaluations.
    Add to Wishlist
    Download
    AI Customize
    Dashboard template showing a line chart of page likes over months with marked events in June and August.
    Add to Wishlist
    Download
    AI Customize
    Executive dashboard slide with a colorful line chart for yearly performance.
    Add to Wishlist
    Download
    AI Customize
    Dashboard Model PowerPoint slide showing statistics, graphs, and icons representing business data analysis.
    Add to Wishlist
    Download
    AI Customize
    KPI dashboard showcasing private school growth with yellow bar charts indicating critical, low, none, and high levels.