Free - Effective Speedometer PowerPoint Template Presentation

Free
Effective Speedometer PowerPoint Template Presentation
P.ID : 66277
    686 views
    233 Downloads
    Get Custom Slides by Experts
    Instantly Access Templates in PowerPoint

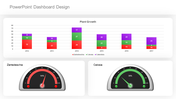
    Free Speedometer PPT Slide

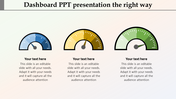
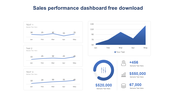
    Get started with this amazing Speedometer PowerPoint Template Free Download. It is an excellent slide with stunning infographic images, which will allow you to make the best dashboard presentation to communicate your KPI metrics. It is also 100% editable and allows you to edit the background, nodes, colors, etc.

    About the template:

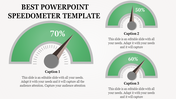
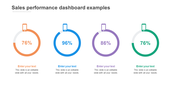
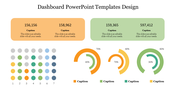
    The Speedometer PowerPoint Template free Download features a speedometer with four metrics: start, light, normal, and bad. It also has four text holders to present the notes. Bright colors are used in this slide to show the stages. Using this well-crafted slide, you can make perfect presentations within a few minutes without spending even a single penny. Get more Editable Speedometer PowerPoint Templates from our site.

    Features of this template:

    1. 100% customizable slides and easy to download.
    2. Slides available in different nodes & colors.
    3. The slide contained 16:9 and 4:3 formats.
    4. Easy to change the slide colors quickly.
    5. Well-crafted template with instant download facility.
    6. It has a professional-looking layout.
    Advertisement

    You May Also Like These PowerPoint Templates

    Add to Wishlist
    Download
    AI Customize
    Gray slide layout with a semicircular gauge in gradient colors of red, orange, and green, and a sidebar with text.
    Add to Wishlist
    Download
    AI Customize
    Executive dashboard with four blue horizontal boxes containing text and a smiling cartoon man gesturing on the right.
    Add to Wishlist
    Download
    AI Customize
    Dashboard with a multi-colored semicircular gauge divided into four sections, labeled 01 to 04, and captions on the right.
    Add to Wishlist
    Download
    AI Customize
    Central tachometer gauge surrounded by six numbered circles in blue, red, teal, orange, purple, and yellow, in an arc layout.
    Add to Wishlist
    Download
    AI Customize
    Business analysis dashboard with a bar chart and an illustrated man holding a pointer in a dark background.
    Add to Wishlist
    Download
    AI Customize
    Dashboard slide with a speedometer gauge in red, blue, yellow, and teal, and text bullet points on the left.
    Add to Wishlist
    Download
    AI Customize
    PPT template featuring a marketing dashboard with a colorful pie chart, bar graph, and progress bars for data presentation.
    Add to Wishlist
    Download
    AI Customize
    Green themed diagram illustrating stages of analysis delivery, from data source to client reports and dashboards.
    Add to Wishlist
    Download
    AI Customize
    A slide showcasing four different chart types from Column Histogram to Scatter Plot with corresponding data.
    Add to Wishlist
    Download
    AI Customize
    Project summary dashboard showing project statistics, budget, actual performance, and project performance by category.
    Add to Wishlist
    Download
    AI Customize
    Circular gauge template with sections in red, orange, yellow, green, and dark green, with captions on either side.
    Add to Wishlist
    Download
    AI Customize
    Infographic dashboard featuring a world map with COVID-19 case data, a gender-based death rate chart, and a pie chart.
    Add to Wishlist
    Download
    AI Customize
    Sashboard design featuring three plant species data and corresponding progress meters in red, green, and blue.
    Add to Wishlist
    Download
    AI Customize
    Chart PPT template showing 4 progress circles with percentages and color coded sections for Blue, Green, Yellow, and Orange.
    Free
    Add to Wishlist
    Download
    AI Customize
    Executive dashboard slide with five numbered circular icons on dark blue shapes, each labeled with key principles.
    Add to Wishlist
    Download
    AI Customize
    Dashboard layout with bar, pie, and stacked charts in yellow, orange, red, and green on a white background.