Effective Gaugue PowerPoint Template Presentations

Circular gauge template with sections in red, orange, yellow, green, and dark green, with captions on either side.
P.ID : 52942
    397 views
    76 Downloads
    Get Custom Slides by Experts
    Instantly Access Templates in PowerPoint

    Creative Gaugue Meter Powerpoint Template For Condition Presentation

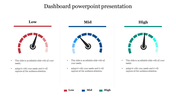
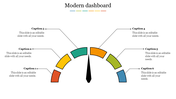
    Download our Gaugue PowerPoint Template to make your analysis presentation engaging and feel great. This slide is designed with an Animation meter to illustrate the condition from poor to good. Users can utilize this template in business plan meetings and public meetings. 

    About this slide:

    This Gaugue PowerPoint Template contains one meter and five captions. Users can add their condition data to a caption in a matter of time. This template will engage your audience and boost their excitement. We also have a wide range of dashboard PPT PowerPoint PPT slides. It is a pre-built slide with all the meter elements you need to design the most helpful presentation. Users can edit the color, text, and font style at your ease.

    Features of this template

    • 100% Customizable (shape color, size & text)
    • This template has a Dashboard theme.
    • Drag and drop image placeholder
    • Huge Collections of meter slides to impress your audience
    • It further supports an aspect ratio of the 16:9 and 4:3 format
    • Easily readable and acceptable template.
    Advertisement

    You May Also Like These PowerPoint Templates

    Add to Wishlist
    Download
    AI Customize
    Circular gauge template with sections in red, orange, yellow, green, and dark green, with captions on either side.
    Add to Wishlist
    Download
    AI Customize
    Infographic dashboard featuring a world map with COVID-19 case data, a gender-based death rate chart, and a pie chart.
    Add to Wishlist
    Download
    AI Customize
    Sashboard design featuring three plant species data and corresponding progress meters in red, green, and blue.
    Add to Wishlist
    Download
    AI Customize
    Chart PPT template showing 4 progress circles with percentages and color coded sections for Blue, Green, Yellow, and Orange.
    Free
    Add to Wishlist
    Download
    AI Customize
    Executive dashboard slide with five numbered circular icons on dark blue shapes, each labeled with key principles.
    Add to Wishlist
    Download
    AI Customize
    Dashboard layout with bar, pie, and stacked charts in yellow, orange, red, and green on a white background.
    Add to Wishlist
    Download
    AI Customize
    Infographic featuring pie graph, horizontal and vertical bar charts for visualizing data trends and comparisons.
    Add to Wishlist
    Download
    AI Customize
    PowerPoint slide for executive dashboard featuring four icons target, speed, error reduction, and growth with text area.
    Add to Wishlist
    Download
    AI Customize
    Executive slide showing expense meters, world sales performance, and bar graphs for margin, expenses, and revenue by month.
    Add to Wishlist
    Download
    AI Customize
    KPI template displaying financial metrics, including sales, profitability, liquidity, and leverage, with two gauge charts.
    Add to Wishlist
    Download
    AI Customize
    Executive dashboard slide with a pie chart, bar graph, area chart, and a profile section for job title and details.
    Add to Wishlist
    Download
    AI Customize
    KPI dashboard template PowerPoint slide featuring three sections for data visualization.
    Add to Wishlist
    Download
    AI Customize
    Dashboard layout including a bar chart of company data, a pie chart for quarterly sales distribution.
    Add to Wishlist
    Download
    AI Customize
    KPI template with three gauges displaying progress levels for sales, production, and downloads.
    Add to Wishlist
    Download
    AI Customize
    Dashboard gauges with red, yellow, green indicators showing low, medium, high performance against a gray background.
    Free
    Add to Wishlist
    Download
    AI Customize
    Pie chart in orange, red, green, and blue sections with two text labels on either side, highlighting sales performance.