Free - Free Dashboard PPT Template Model Slides PowerPoint

Free
Dashboard infographic with three gauge meters in blue, green, and yellow, each labeled with a number and caption.
P.ID : 35303
    800 views
    289 Downloads
    Get Custom Slides by Experts
    Instantly Access Templates in PowerPoint

    Simple Dashboard Theme Presentation Slides


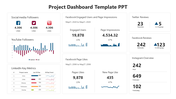
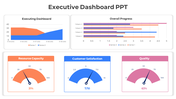
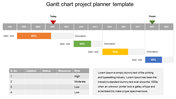
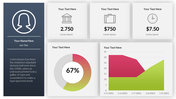
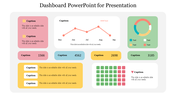
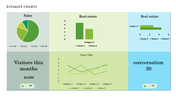
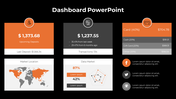
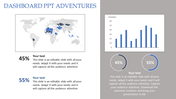
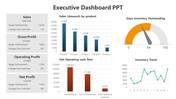
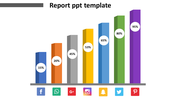
    Introducing our collection of Free Dashboard PPT Templates, designed to help you visualize data and make informed decisions. Our engaging templates offer a creative and informative way to present your business metrics and key performance indicators. With vibrant graphics, you can easily customize the dashboard to suit your specific needs. Whether you're tracking sales, analyzing market trends, or monitoring project progress, our templates provide clarity and simplicity. Impress your audience with visually appealing presentations that effectively communicate your data-driven insights. Try our templates today and unlock the power of data visualization.


    Features of the template

    • 100% customizable slides and easy to download.
    • Slides are available in different nodes & colors.
    • The slide contains 16:9 and 4:3 formats.
    • Easy to change the slide colors quickly.
    • Well-crafted template with an instant download facility. 
    • Access on both MS PowerPoint and Google Slides.
    • Three vibrant nodes are included.
    • Highly compatible with PowerPoint, Google Slides and Canva template.
    Advertisement

    You May Also Like These PowerPoint Templates

    Add to Wishlist
    Download
    AI Customize
    Executive dashboard PowerPoint slide featuring line and bar charts, pie charts, and world map markers for data analysis.
    Add to Wishlist
    Download
    AI Customize
    Gantt chart with colorful horizontal bars spanning from January to June, representing project timelines and milestones.
    Free
    Add to Wishlist
    Download
    AI Customize
    Slide with line and trends charts, showing five columns of data with placeholder text for each chart segment.
    Free
    Add to Wishlist
    Download
    AI Customize
    Five-level bar chart executive dashboard with colored blocks labeled with five levels, showing a gradual progression.
    Free
    Add to Wishlist
    Download
    AI Customize
    PowerPoint slide with a bar chart showcasing three data series for different examples.
    Add to Wishlist
    Download
    AI Customize
    Dashboard themed PowerPoint slide with six gauges and captions for content.
    Add to Wishlist
    Download
    AI Customize
    Chart layout with stacked bar graphs in red, yellow, green, and teal representing A1 to A8, with captions above.
    Add to Wishlist
    Download
    AI Customize
    Infographic template with bar, pie, and world map charts for PowerPoint presentations in shades of red and orange.
    Add to Wishlist
    Download
    AI Customize
    3D cone charts in blue shades with percentage labels, showing two datasets with a legend on the right.
    Add to Wishlist
    Download
    AI Customize
    KPI dashboard with a mix of bar, pie, and line charts highlighting revenue, sales, and customer buying patterns.
    Add to Wishlist
    Download
    AI Customize
    Our Predesigned KPI Presentation Template Slide Design
    Add to Wishlist
    Download
    AI Customize
    Modern dashboard PowerPoint template featuring circular progress charts, bar graphs, and key performance metrics.
    Free
    Add to Wishlist
    Download
    AI Customize
    Bar chart comparing increases and decreases for movies like Avatar and Aquaman, with title logos below.
    Add to Wishlist
    Download
    AI Customize
    Dashboard PPT template with three colored gauges showing 30, 60, and 90 percent completion with captions.
    Add to Wishlist
    Download
    AI Customize
    Gantt chart template illustrating project phases, milestones, and a timeline structure from January to December.
    Add to Wishlist
    Download
    AI Customize
    Slide showing a bar chart with values for 2017, 2018, 2019, and 2020, with each year represented in different shades of blue.
    Add to Wishlist
    Download
    AI Customize
    Matrix chart with skill and will axes, divided into quadrants labeled high and low, with numbered circles and icons.