Attractive KPI Dashboard PowerPoint And Google Slides

KPI dashboard featuring a funnel chart, audience metrics, bar graph, and a circular chart with 2021 data.
P.ID : 1783
    2.6K+ views
    235 Downloads
    Get Custom Slides by Experts
    Instantly Access Templates in PowerPoint

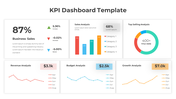
    Get The KPI Dashboard PowerPoint Template


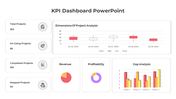
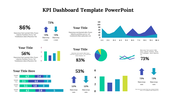
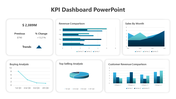
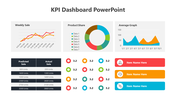
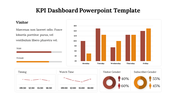
    The KPI Dashboard Template is a powerful management tool designed to streamline data visualization and decision-making. This comprehensive dashboard consists of four distinct parts offering valuable insights into student categorization.

    This KPI template serves as a robust monitoring system for educational institutions or programs. It effectively tracks student data, categorizing them into critical, low, high, and none categories, while highlighting emergency and safe percentages.

    Ideal for school administrators, education policymakers, or management teams seeking an insightful overview of student performance and safety levels. It's beneficial during academic reviews, board meetings, or educational presentations to evaluate student statistics effectively.

    Features of this template


      • 100% customizable slides and easy to download.
      • The slide contains 16:9 and 4:3 formats.
      • Easy to change the colors of the slide quickly.
      • Highly compatible with PowerPoint and Google Slides.
      Advertisement

      You May Also Like These PowerPoint Templates

      Free
      Add to Wishlist
      Download
      AI Customize
      Purple bar chart PPT slide with years 2018 to 2021 and percentages and a businesswoman presenting the information.
      Free
      Add to Wishlist
      Download
      AI Customize
      Layered area chart with Series 1 in yellow, Series 2 in orange, and Series 3 in black, showing data trends over time.
      Add to Wishlist
      Download
      AI Customize
      Clustered bar chart comparing data across quarters with horizontal bars in various colors.
      Add to Wishlist
      Download
      AI Customize
      Slide with three vertical boxes in blue, red, and green banners, and rounded icons labeled K, W, and L for learning stages.
      Add to Wishlist
      Download
      AI Customize
      Line graph infographic showing data from 2015 to 2020, with three colored lines in purple, yellow, and green, and text.
      Add to Wishlist
      Download
      AI Customize
      Donut chart in blue and orange displaying percentage, with matching colored caption boxes on either side.
      Add to Wishlist
      Download
      AI Customize
      Our Predesigned Chart Templates PPT Slides Designs
      Add to Wishlist
      Download
      AI Customize
      KWL chart slide with three columns in blue, red, and gold, representing learning insights.
      Add to Wishlist
      Download
      AI Customize
      Infographic with four bar graphs, each showing data points A to D, and captions areas in green boxes.
      Free
      Add to Wishlist
      Download
      AI Customize
      PowerPoint presentation slide featuring a stacked bar chart, aerial landscape photo, and a comparison table of drone data.
      Free
      Add to Wishlist
      Download
      AI Customize
      PowerPoint slide with a circular pie chart showing four segments labeled with percentages and a placeholder text.
      Add to Wishlist
      Download
      AI Customize
      Customized Kubler Ross PowerPoint Presentation Template
      Add to Wishlist
      Download
      AI Customize
      Visual of boost engagement growth with stacked bar categories: newsletter sign-ups, premium customers, and followers.
      Add to Wishlist
      Download
      AI Customize
      Pie charts showing data percentages for growth, with three percentage values with placeholder text.
      Add to Wishlist
      Download
      AI Customize
      A medical themed PowerPoint slide with three colorful circular progress bars showing percentages, each with related icons.
      Free
      Add to Wishlist
      Download
      AI Customize
      Chart infographic with four drop shaped gauge style meters in blue, green, yellow, and red, each with text below.
      Add to Wishlist
      Download
      AI Customize
      Dual chart template slide with scatter and bubble charts, the scatter chart on the left and the bubble chart on the right.
      Free
      Add to Wishlist
      Download
      AI Customize
      Slide with green and white sections, featuring pie and bar charts, and an engine image in the bottom right corner.
      Add to Wishlist
      Download
      AI Customize
      Chart with five blue vertical bars showing percentages, paired with captions, on a white background.