Free - Attractive Chart Presentation Template and Google Slides

Free
Slide with green and white sections, featuring pie and bar charts, and an engine image in the bottom right corner.
P.ID : 33747
    300 views
    71 Downloads
    Get Custom Slides by Experts
    Instantly Access Templates in PowerPoint

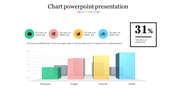
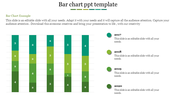
    Easy to Follow Chart Presentation Template


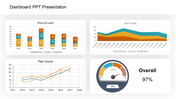
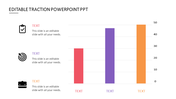
    Designed with a refreshing green color tone, this chart presentation template features a prominent bar chart diagram, providing you with a striking platform to showcase your data. The bold font and white background amplify the visual impact, ensuring your message commands attention and is easy to understand.

    With ample caption space for text, you can convey complex information with clarity and precision, making it ideal for presenting financial results or market trends. This template will help you engage your audience and drive impact, allowing you to present your data with confidence and clarity.

    Download now and experience the transformative power of data visualization! Elevate your presentations and make your data come to life with our visually appealing template.

    Feature of the template

    • 100% customizable slides and easy to download.
    • Slides are available in different nodes & colors.
    • The slide is contained in 16:9 and 4:3 format.
    • Easy to change the slide colors quickly.
    • Well-crafted template with an instant download facility. 
    Advertisement

    You May Also Like These PowerPoint Templates

    Free
    Add to Wishlist
    Download
    AI Customize
    Bar chart with five vertical bars representing data analysis with various high, low, and volume indicators displayed.
    Add to Wishlist
    Download
    AI Customize
    KPI themed slide with data visualization including pie charts, bar graphs, line graphs, and key metrics.
    Free
    Add to Wishlist
    Download
    AI Customize
    Colorful bar chart with three data categories and corresponding bars each with caption areas.
    Add to Wishlist
    Download
    AI Customize
    Six semicircular gauges with colored indicators in red, purple, blue, yellow, pink, and green on a white backdrop.
    Free
    Add to Wishlist
    Download
    AI Customize
    Slide showcasing three different types of colored charts an area chart, a bar chart, and a line chart, with captions below.
    Add to Wishlist
    Download
    AI Customize
    Three pie charts with segmented sections and percentage labels, each chart featuring placeholder text below.
    Add to Wishlist
    Download
    AI Customize
    A pie chart template with three circular charts representing each with text and icons beside them.
    Add to Wishlist
    Download
    AI Customize
    Area chart with a teal base and five markers in yellow, red, and maroon shades representing growth percentages.
    Add to Wishlist
    Download
    AI Customize
    Awesome Dashboard PPT Template Free Download Slides
    Add to Wishlist
    Download
    AI Customize
    Pie Chart PowerPoint with Segmented Circles Slides
    Add to Wishlist
    Download
    AI Customize
    Template displaying a structured flowchart for KPI types, categorized into qualitative and quantitative evaluations.
    Add to Wishlist
    Download
    AI Customize
    Four segmented doughnut charts in yellow, red, purple, and blue with black circular labels, percentage values, and captions.
    Add to Wishlist
    Download
    AI Customize
    Illustration of a chart with yellow, red, and green horizontal bars displaying percentages and paper boat icons on waves.
    Add to Wishlist
    Download
    AI Customize
    KPI dashboard showcasing private school growth with yellow bar charts indicating critical, low, none, and high levels.
    Add to Wishlist
    Download
    AI Customize
    A vertical green color bar chart slide displaying loss data from 2014 to 2019, with the title at the top.
    Add to Wishlist
    Download
    AI Customize
    Dashboard slide showing colour coded plant growth chart with progress ring visuals and percentages.
    Add to Wishlist
    Download
    AI Customize
    Donut chart with four colorful quadrants and text placeholders, connected by lines to circular percentage labels around it.