Creative Line Chart Infographics PowerPoint Presentation

Pack of 36 slides
P.ID : 69034
Advertisement
452 views
119 Downloads
Get Custom Slides by Experts
Instantly Access Templates in PowerPoint

Line Infographic Templates For Your Needs

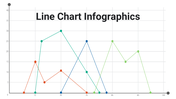
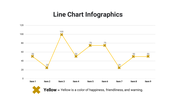
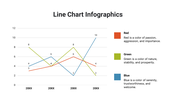
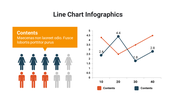
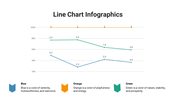
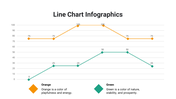
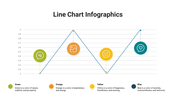
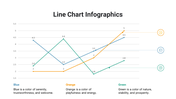
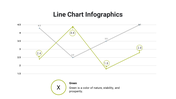
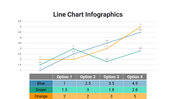
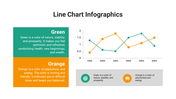
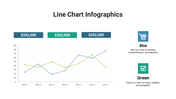
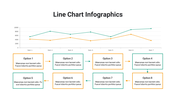
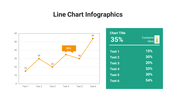
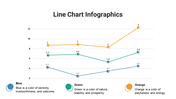
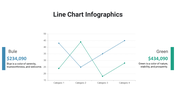
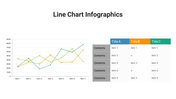
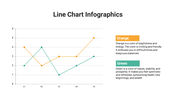
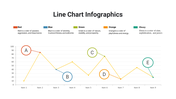
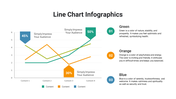
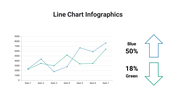
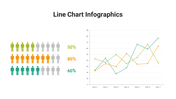
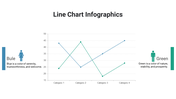
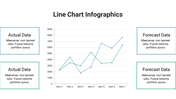
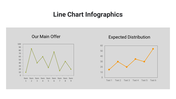
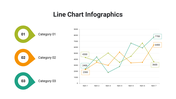
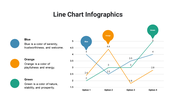
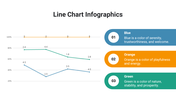
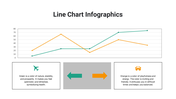
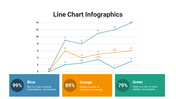
What type of line infographic design do you want? In a 3D style, flat style, or curve style, we have more than 36 chart infographics in a single pack. You can pick and choose any slide that you prefer. These line charts are mainly used for representing a business or any type of data in a numerical style based on its growth or improvement. Slide Egg has numerous collections of charts, mostly in the form of graphs. You can take a look at our collection and just download them for your needs. It has well-designed chart layouts and is easy to customize. Get this Google slide theme layouts for your PowerPoint presentation. Give it a shot!

Features of the template

  • 100% customizable slides and easy to download.
  • Slides are available in different nodes & colors.
  • The slides contain 16:9 and 4:3 formats.
  • Easy to change the colors quickly.
  • It is a well-crafted template with an instant download facility.
  • It is a 100% pre-designed slide.
  • The slides in this deck hold editable graphs and charts.

You May Also Like These PowerPoint Templates

Add to Wishlist
Download
AI Customize
KPI PowerPoint slide featuring three colored gauges for Revenue, Sales, and Sales Value with respective values.
Add to Wishlist
Download
AI Customize
KPI dashboard template with bar and line graphs showing private school growth for 2017, 2018, and 2019 with educational data.
Free
Add to Wishlist
Download
AI Customize
Free KPI Presentation PPT Template and Google Slides
Add to Wishlist
Download
AI Customize
3D pie chart with four color-coded segments red, orange, yellow, and brown displaying percentage values.
Free
Add to Wishlist
Download
AI Customize
Bar chart slide with three stacked bars, each divided into segments with percentage labels, and a table on the right.
Add to Wishlist
Download
AI Customize
Gantt chart layout with five vertical milestone markers in blue, black, brown, green, and yellow.
Add to Wishlist
Download
AI Customize
Timeline charts slides showcasing different stages and tasks across various projects, with color coded bars for each task.
Free
Add to Wishlist
Download
AI Customize
Slide with four green donut charts and two horizontal bar graphs showing data comparisons across quarters and months.
Free
Add to Wishlist
Download
AI Customize
Illustration of six red bars with corresponding percentages and a businesswoman standing beside them.
Free
Add to Wishlist
Download
AI Customize
Business strategy chart with blue headers for months, showing green bars representing schedules.
Add to Wishlist
Download
AI Customize
Stacked bar chart with four vertical bars showing percentages from 2013, 2014, and 2015 in varying green shades.
Free
Add to Wishlist
Download
AI Customize
Business plan slide showing bar chart comparing impact of society, customer satisfaction, and people satisfaction.
Add to Wishlist
Download
AI Customize
Color-coded bars representing business growth from 2015 to 2019, with a percentage line graph above showing a rise.
Add to Wishlist
Download
AI Customize
Project timeline Gantt chart with color coded bars indicating task descriptions, assigned resources, and milestone markers.
Add to Wishlist
Download
AI Customize
PPT slide displaying various charts including bar charts, pie charts, calendars, and Gantt charts for project tracking.
Add to Wishlist
Download
AI Customize
Template showcasing various chart designs, including line, bar, pie, and comparison charts across multiple slides.
Add to Wishlist
Download
AI Customize
Creative charts showing a circular 60% approval metric, bar graphs, and a 55% Twitter engagement donut chart.
Free
Add to Wishlist
Download
AI Customize
PPT slide with a yellow bar chart showing percentages for the years 2016 to 2021 with a woman standing next to the chart.
Free
Add to Wishlist
Download
AI Customize
Gantt chart plan template showing tasks across months with a colorful circular pie chart and matching bars on theright.
Free
Add to Wishlist
Download
AI Customize
Bar chart comparing metrics over years alongside a diagram linking manager, idea, and management to business growth.
Add to Wishlist
Download
AI Customize
Project schedule slide with a Gantt chart displaying tasks, timelines, and completion percentages.
Free
Add to Wishlist
Download
AI Customize
Horizontal Gantt chart showing tasks by days with segments in blue, purple, and black, indicating task progress and status.
Add to Wishlist
Download
AI Customize
Funnel infographic with blue, red, yellow, and green sections, each with icons, connected to text descriptions.
Free
Add to Wishlist
Download
AI Customize
Four vertical orange columns and percentages, labeled by year, along with a businesswoman illustration on the right.
Free
Add to Wishlist
Download
AI Customize
3D green pie chart infographic divided into four steps of varying heights, with numbered labels and descriptions around it.
Free
Add to Wishlist
Download
AI Customize
Annual report slide with orange bar graphs showing percentage growth from 2014 to 2021, paired with captions on the left.
Free
Add to Wishlist
Download
AI Customize
Chart with colorful bars representing yearly data from 2013 to 2020, paired with eight colorful cube icons on the sides.
Add to Wishlist
Download
AI Customize
Gantt chart PPT slide displaying tasks with start and end dates, milestones, and progress tracking for each month.
Add to Wishlist
Download
AI Customize
Infographic chart with a truck carrying five colorful blocks and percentage bars, using green, orange, and brown tones.
Free
Add to Wishlist
Download
AI Customize
Bar chart PowerPoint slides showcasing different business categories with colorful bars in different layout designs.
Add to Wishlist
Download
AI Customize
Gantt chart slide with monthly columns showing project tasks and subtasks progress using blue shades to indicate status.
Free
Add to Wishlist
Download
AI Customize
Gantt chart slide with monthly timeline across three teams, using blue, orange, and green bars to indicate priority items.
Free
Add to Wishlist
Download
AI Customize
Vertical bars in purple, blue, green, yellow, orange, and pink showing percentages, next to a businesswoman.