PowerPoint Chart Template And Google Slides-Three Node
Nodes
Colors

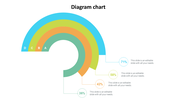

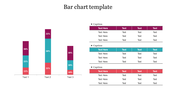


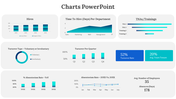
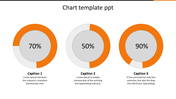

Data PPT Chart Template Presentation
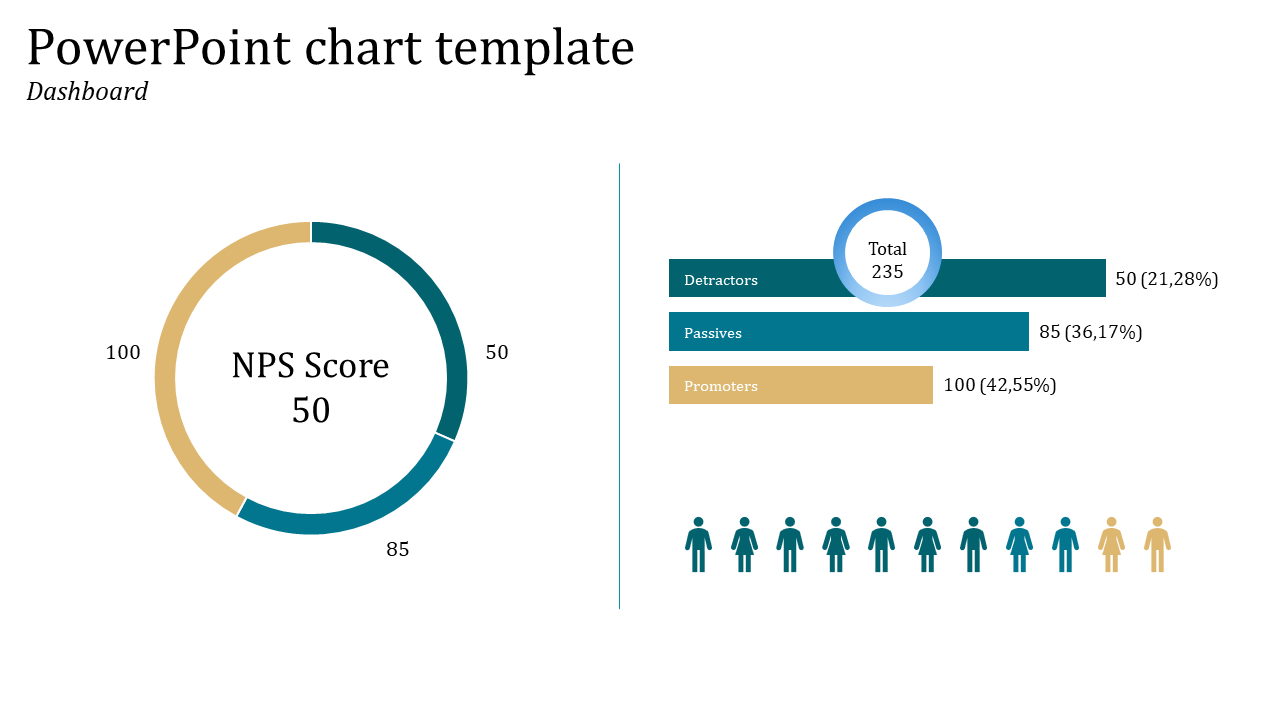
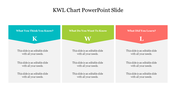
With this PowerPoint template, you get a chart already made to help you display your Net Promoter Score (NPS) data. It has three sections divided between promoters, passives, and detractors and also has shaded silhouettes of people to add a color-coded effect.
Don’t waste your time making charts from scratch. Use this template, add your data and if you want, change the colors to fit your brand.
An eye-catching chart helps you grab the attention of your audience and leaves your presentation associated with something interesting.
Who can benefit? Any kind of business, small or big, that aims to understand and increase customer satisfaction. Suitable for sales pitches, marketing presentations, reports to investors, etc.
Get this PowerPoint Chart template now and start making presentations that wow your audience!
Features of the template
- 100% customizable slides and easy to download.
- The slides contain 16:9 and 4:3 formats.
- Easy to change the colors quickly.
- It is a well-crafted template with an instant download facility.
- It is a 100% pre-designed slide.
- The slide holds vibrant colors.
More Collections for PowerPoint Chart Template
Recommended based on this template.









Similar Templates to PowerPoint Chart Template















Showing20 of69,218 templates