Free - Editable Chart PowerPoint Template And Google Slides

Free
Bar chart comparing business targets and profits across quarters, with orange and blue bars labeled by month.
P.ID : 3584
    568 views
    130 Downloads
    Get Custom Slides by Experts
    Instantly Access Templates in PowerPoint

    Editable Chart PowerPoint Template


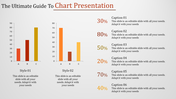
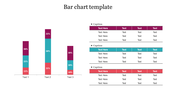
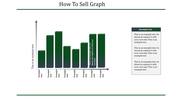
    Embark on a dynamic journey of data visualization with our Chart Template for PowerPoint and Google Slides, meticulously designed for professionals seeking impactful presentations. This versatile template introduces a novel approach, particularly focusing on the "Business Target vs Profit Model Chart." Prioritizing simplicity and creativity, it transcends conventional chart designs, ensuring complex business concepts are communicated with clarity and impact. Tailored for business analysts, executives, and marketing professionals, this template proves indispensable for effectively conveying business targets and profit models. With fully editable slides and a vibrant multicolor theme, users gain flexibility in tailoring content to specific needs, fostering a visually engaging narrative that captivates audiences. From startups to established corporations, this template caters to a diverse user base, offering a visual storytelling tool that enhances presentations. Presenters benefit from increased engagement, clear communication, and the ability to dynamically showcase data insights. Encourage your audience to leverage this template as a strategic asset for delivering compelling presentations that not only inform but captivate, leaving a lasting impact and elevating the standard of visual communication in professional settings.


    Features of this template


    • 100% customizable slides and easy to download.
    • Slides are available in different nodes & colors.
    • The slide contained 16:9 and 4:3 formats.
    • Easy to change the slide colors quickly.
    • It is a well-crafted template with an instant download facility.
    Advertisement

    You May Also Like These PowerPoint Templates

    Free
    Add to Wishlist
    Download
    AI Customize
    Slide with four green donut charts and two horizontal bar graphs showing data comparisons across quarters and months.
    Free
    Add to Wishlist
    Download
    AI Customize
    Illustration of six red bars with corresponding percentages and a businesswoman standing beside them.
    Free
    Add to Wishlist
    Download
    AI Customize
    Business strategy chart with blue headers for months, showing green bars representing schedules.
    Add to Wishlist
    Download
    AI Customize
    Stacked bar chart with four vertical bars showing percentages from 2013, 2014, and 2015 in varying green shades.
    Free
    Add to Wishlist
    Download
    AI Customize
    Business plan slide showing bar chart comparing impact of society, customer satisfaction, and people satisfaction.
    Add to Wishlist
    Download
    AI Customize
    Color-coded bars representing business growth from 2015 to 2019, with a percentage line graph above showing a rise.
    Add to Wishlist
    Download
    AI Customize
    Project timeline Gantt chart with color coded bars indicating task descriptions, assigned resources, and milestone markers.
    Add to Wishlist
    Download
    AI Customize
    PPT slide displaying various charts including bar charts, pie charts, calendars, and Gantt charts for project tracking.
    Add to Wishlist
    Download
    AI Customize
    PPT chart with five colorful percentage indicators displayed in curved circular segments, ranging from 30 to 70 percent.
    Add to Wishlist
    Download
    AI Customize
    Template showcasing various chart designs, including line, bar, pie, and comparison charts across multiple slides.
    Add to Wishlist
    Download
    AI Customize
    Creative charts showing a circular 60% approval metric, bar graphs, and a 55% Twitter engagement donut chart.
    Free
    Add to Wishlist
    Download
    AI Customize
    PPT slide with a yellow bar chart showing percentages for the years 2016 to 2021 with a woman standing next to the chart.
    Free
    Add to Wishlist
    Download
    AI Customize
    Gantt chart plan template showing tasks across months with a colorful circular pie chart and matching bars on theright.
    Free
    Add to Wishlist
    Download
    AI Customize
    Bar chart comparing metrics over years alongside a diagram linking manager, idea, and management to business growth.
    Add to Wishlist
    Download
    AI Customize
    Project schedule slide with a Gantt chart displaying tasks, timelines, and completion percentages.
    Free
    Add to Wishlist
    Download
    AI Customize
    Comparison of revenue and cost distributions with pie charts displaying CAPEX and OPEX percentages.
    Free
    Add to Wishlist
    Download
    AI Customize
    Horizontal Gantt chart showing tasks by days with segments in blue, purple, and black, indicating task progress and status.
    Add to Wishlist
    Download
    AI Customize
    Funnel infographic with blue, red, yellow, and green sections, each with icons, connected to text descriptions.
    Free
    Add to Wishlist
    Download
    AI Customize
    Four vertical orange columns and percentages, labeled by year, along with a businesswoman illustration on the right.