Multicolor Cycle Chart PowerPoint Slide Design

Cycle chart slide featuring four percentage indicators in teal, green, blue, and red, with captions beow.
P.ID : 47623
    286 views
    52 Downloads
    Get Custom Slides by Experts
    Instantly Access Templates in PowerPoint

    Cycle Chart PPT Slide 

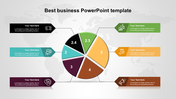
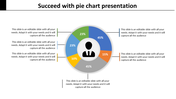
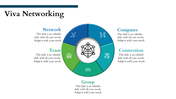
    Don't be intimidated by traditional charts; the Cycle Charts are a different kind of one-in-a-million presentation. Each node represents the data point with its own color, making it easier to visibly see the analytical data. As an interactive tool, it helps you keep up with your analysis as you move around your slide deck. It is used for visualizing the growth, progress, and more of a thing. Also, when you want to describe that "the cycle" or process doesn't have a beginning or end. Depending on which type of cycle you want to transform your presentation, go for the one that suits your data analysis. Grease your wheels of success with our slides now!

    Features of the template

    • 100% customizable slides and easy to download.
    • Slides are available in different nodes & colors.
    • The slide contained 16:9 and 4:3 formats.
    • Easy to change the slide colors quickly.
    • Well-crafted template with an instant download facility.
    • Four nodes in vibrant hues.
    Advertisement

    You May Also Like These PowerPoint Templates

    Add to Wishlist
    Download
    AI Customize
    Sales strategy slide with a multicolored chart, business icons, and descriptions for marketing, branding, and planning.
    Free
    Add to Wishlist
    Download
    AI Customize
    Chart template with a central circle and four speech bubbles with each holdoing a placeholder text areas.
    Add to Wishlist
    Download
    AI Customize
    Circular chart with six green segments featuring percentages, and a central icon of stacked money, paired with text.
    Free
    Add to Wishlist
    Download
    AI Customize
    Green pie chart divided into four labeled sections, showing percentage values with text annotations.
    Add to Wishlist
    Download
    AI Customize
    Progress chart slide showing four colorful circular charts labeled from business to report with varying percentages and text.
    Add to Wishlist
    Download
    AI Customize
    Three segment pie chart in shades of red and orange with percentages, aligned next to three captions on the right.
    Add to Wishlist
    Download
    AI Customize
    Colorful pie chart slide showing five distinct stages with varying percentage values each with numbered placeholder text.
    Free
    Add to Wishlist
    Download
    AI Customize
    A pie chart slide is divided into five colorful sections and icons, each with a number and connected to descriptive captions.
    Free
    Add to Wishlist
    Download
    AI Customize
    Smart pie chart with five segments in different colors, displaying percentages, with three placeholder text to the right.
    Free
    Add to Wishlist
    Download
    AI Customize
    Five part pie chart slide illustrating crucial company processes, each section numbered and color coded.
    Free
    Add to Wishlist
    Download
    AI Customize
    Four circular progress graphs in blue, orange, red, and green, each showing percentages and captions.
    Add to Wishlist
    Download
    AI Customize
    Chart maker slide with a 3D pie chart labeled for each quarter and four editable text boxes on the right side.
    Free
    Add to Wishlist
    Download
    AI Customize
    Colorful pie chart slide showing five segments with percentages, paired with four content boxes for additional information.
    Free
    Add to Wishlist
    Download
    AI Customize
    A circular pie chart in blue and orange at the center, flanked by two rectangular sections with icons and text details.
    Add to Wishlist
    Download
    AI Customize
    Colorful custom pie chart slide displaying three segments with percentages along with caption placeholders.
    Add to Wishlist
    Download
    AI Customize
    Three circular progress charts in red, teal, and yellow, with percentage levels, displayed on a black rectangular box.
    Add to Wishlist
    Download
    AI Customize
    Cute Pie Chart  Diagram PowerPoint Presentation Template