Download Pie Chart Presentation Template and Google Slides

Slide with a pie chart illustrating data breakdown in percentages, complemented by matching caption areas.
P.ID : 16721
    452 views
    49 Downloads
    Get Custom Slides by Experts
    Instantly Access Templates in PowerPoint

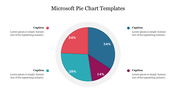
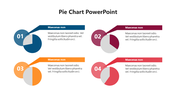
    Unveiling Insights: Pie Chart PPT Template


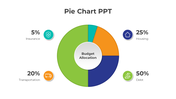
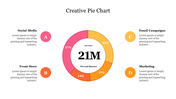
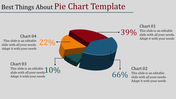
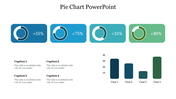
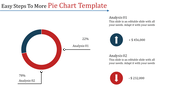
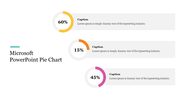
    Pie charts offer a visually compelling way to showcase data proportions, aiding in easy comprehension and analysis. Download our Pie Chart Presentation Template and Google Slides Themes, featuring a dynamic pie chart with four distinct colors. Each color segment corresponds to a percentage level and includes a caption and text area for a detailed explanation.

    This versatile template is perfect for analysts, educators, and business professionals alike. Whether presenting market trends, budget breakdowns, or survey results, our template empowers users to convey complex information concisely and effectively.

    Transform your data into compelling visual narratives. Download our template today and captivate your audience with clear, impactful insights.

    Features of the template


    • 100% customizable slides are easy to download.
    • Slides are available in different colors.
    • The slide has 4:3 and 16:9 formats.
    • It is easy to change the slide colors quickly.
    • It has a cute design to impress an audience.
    • Create feature-rich, animated presentations.
    Advertisement

    You May Also Like These PowerPoint Templates

    Add to Wishlist
    Download
    AI Customize
    Pie Chart PPT Presentation Template for Data Analysis
    Free
    Add to Wishlist
    Download
    AI Customize
    Pie chart PPT slide with four sections in different colors and percentages, with accompanying text labels for each section.
    Free
    Add to Wishlist
    Download
    AI Customize
    Pie chart with five equal sections in blue and teal, each labeled with captions and arrows pointing to descriptions.
    Add to Wishlist
    Download
    AI Customize
    Central 3D pie chart with eight colorful segments, each linked to numbered captions placed around it.
    Add to Wishlist
    Download
    AI Customize
    Colorful pie chart with six segments, each labeled with percentages and color-coded text on the right.
    Add to Wishlist
    Download
    AI Customize
    3D pie chart in red, blue, and orange segments with three captions on a light gradient background.
    Free
    Add to Wishlist
    Download
    AI Customize
    Business slide featuring a colorful pie chart, numbered text placeholders, and 3D figures representing teamwork.
    Add to Wishlist
    Download
    AI Customize
    Cycle chart slide featuring four percentage indicators in teal, green, blue, and red, with captions beow.
    Add to Wishlist
    Download
    AI Customize
    Business diagram showing a four-section circular chart with two businessmen shaking hands under a lightbulb icon.
    Add to Wishlist
    Download
    AI Customize
    A donut chart with four sections in green, red, and white, labeled with percentages, and text boxes around it.
    Add to Wishlist
    Download
    AI Customize
    Finance template featuring a donut chart with four segments labeled with values and a money icon in the center.
    Free
    Add to Wishlist
    Download
    AI Customize
    Chart template with a central circle and four speech bubbles with each holdoing a placeholder text areas.
    Add to Wishlist
    Download
    AI Customize
    Circular chart with six green segments featuring percentages, and a central icon of stacked money, paired with text.
    Free
    Add to Wishlist
    Download
    AI Customize
    Green pie chart divided into four labeled sections, showing percentage values with text annotations.
    Add to Wishlist
    Download
    AI Customize
    Progress chart slide showing four colorful circular charts labeled from business to report with varying percentages and text.
    Free
    Add to Wishlist
    Download
    AI Customize
    Multi-color pie chart slide deck showing data segments in various shades, each section labelled for visual comparison.
    Add to Wishlist
    Download
    AI Customize
    A color-coded pie chart illustrating four data segments with values 15%, 20%, 30%, and 35%, paired with text captions.
    Add to Wishlist
    Download
    AI Customize
    SmartArt pie chart showing 65% in red and 35% in green as a and b, with placeholder captions and a text box.