Creative Pie Chart PowerPoint Presentation Template

A dynamic slide layout featuring a circular pie chart, with labeled segments and placeholder text.
P.ID : 65114
    312 views
    67 Downloads
    Get Custom Slides by Experts
    Instantly Access Templates in PowerPoint

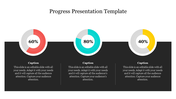
    Colorful Circular Pie Chart Template Presentation Slide


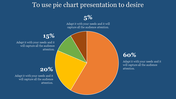
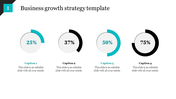
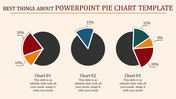
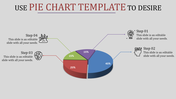
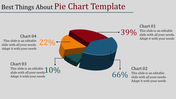
    Get this pie chart slide for the PPT presentation; you can use pie charts to show the percentage as a whole, and it also helps to represent the percentage. It is commonly used in business and schools. You can use this to illustrate the data with the beautifully designed slide. It is user-friendly and easy to edit. Try this circular pie chart slide for the innovative presentation.

    About the template 


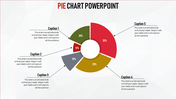
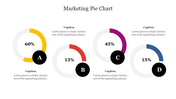
    Acquire this creative pie chart template with a white background that helps to give your an attractive look with a brighter quality. The template has a circular pie chart in four nodes with different colors indicating various percentages. And the template has the four nodded colors with headings and editable texts for you to customize and add points. You can even alter the template with the changes by placing bar graphs, bar lines, and other graphical representations with the features provided by SlideEgg.

    Grab this pie chart template for the beneficial presentation through the graphical representation of marketing to your audience. And try out other slides of blank bar graph template for the presentation from SlideEgg.

    Features of the slide

    • 100% customizable slides and easy to download.
    • Slides are available in different nodes & colors.
    • The slides contained 16:9 and 4:3 formats.
    • Easy to change the slide colors quickly.
    • Well-crafted template with instant download facility.
    • The colorful pie chart slide for the PPT presentation.
    Advertisement

    You May Also Like These PowerPoint Templates

    Add to Wishlist
    Download
    AI Customize
    A medical themed PowerPoint slide with three colorful circular progress bars showing percentages, each with related icons.
    Free
    Add to Wishlist
    Download
    AI Customize
    Chart infographic with four drop shaped gauge style meters in blue, green, yellow, and red, each with text below.
    Add to Wishlist
    Download
    AI Customize
    Dual chart template slide with scatter and bubble charts, the scatter chart on the left and the bubble chart on the right.
    Free
    Add to Wishlist
    Download
    AI Customize
    Slide with green and white sections, featuring pie and bar charts, and an engine image in the bottom right corner.
    Add to Wishlist
    Download
    AI Customize
    Chart with five blue vertical bars showing percentages, paired with captions, on a white background.
    Free
    Add to Wishlist
    Download
    AI Customize
    Infographic with a circular segmented chart in blue shades, centered around an AI head graphic placed in white background.
    Add to Wishlist
    Download
    AI Customize
    Three vertical rectangular sections with headers in green, blue, and orange, each with captions inside.
    Add to Wishlist
    Download
    AI Customize
    Colorful pie chart PowerPoint slide with five labeled sections and captions on a white backdrop.
    Free
    Add to Wishlist
    Download
    AI Customize
    Pie chart slide with a blue and dark blue donut chart showing 75% sales, two numbered text boxes on the right.
    Free
    Add to Wishlist
    Download
    AI Customize
    Green and black area chart with a star shaped yellow badge and four circular icons with text below.
    Free
    Add to Wishlist
    Download
    AI Customize
    Creative infographic with a curved orange graph divided into four steps, each with an icon and label.
    Add to Wishlist
    Download
    AI Customize
    Bar chart with green hues, showing data for six categories, with side status boxes and light text.
    Add to Wishlist
    Download
    AI Customize
    Creative PowerPoint slide with two lines on a chart yellow and red with a green dot marking the highest point on the line.
    Free
    Add to Wishlist
    Download
    AI Customize
    Three column layout with blue megaphone, orange lightbulb, and red envelope icons on a beige background.
    Free
    Add to Wishlist
    Download
    AI Customize
    A simple chart slide with overlaid blue, green, orange, and yellow circles of varying sizes with a graph and captions.
    Add to Wishlist
    Download
    AI Customize
    Gantt chart PowerPoint template showing a timeline for multiple targets across January, February, and March, with milestones.
    Add to Wishlist
    Download
    AI Customize
    3D cone chart with orange, pink, and blue segments, placed on a gray platform with a white background.
    Add to Wishlist
    Download
    AI Customize
    Bar chart slide showing the performance of four products with categories like sales growth, market share, and profit margin.