Free - Buy Highest Quality Pie Chart Template Presentation
Free

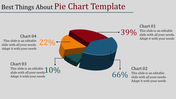
Buy Highest Quality Pie Chart Template Presentation
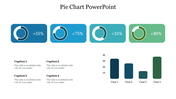
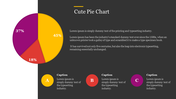
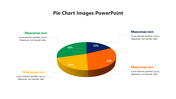
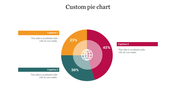
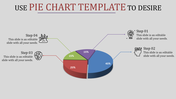
You know you love pie, but do your presentations? We think so too. By using the scrumptious idea of a great deal of pies on your PPT slides, you'll capture your audience's curiosity and attention while still conveying information clearly. This is a slide that's perfect for presenters who want to make their data tell a story. It will also make your PPT stand ahead of the pack. Picture your data sterlingly with the four pie charts and a bar graph. Let your data be clear and engaging with this windfall slide.
Features of the template
- 100% customizable slides and easy to download.
- Slides are available in different nodes & colors.
- The slide contains 16:9 and 4:3 formats.
- Easy to change the colors of the slide quickly.
- Well-crafted template with an instant download facility.


You May Also Like These PowerPoint Templates

Add to Wishlist
Download
Edit

Add to Wishlist
Download
Edit

Add to Wishlist
Download
Edit

Add to Wishlist
Download
Edit

Add to Wishlist
Download
Edit

Add to Wishlist
Download
Edit


Add to Wishlist
Download
Edit


Add to Wishlist
Download
Edit

Add to Wishlist
Download
Edit


