Free - Ready To Use Pie Chart Presentation PPT and Google Slides

Free
Pie chart slide with a blue and dark blue donut chart showing 75% sales, two numbered text boxes on the right.
P.ID : 33851
    294 views
    62 Downloads
    Get Custom Slides by Experts
    Instantly Access Templates in PowerPoint

    Pie Chart Presentation


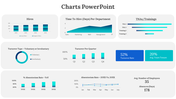
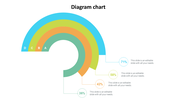
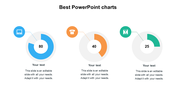
    Uplift your data-based presentations by introducing our Pie Chart Presentation slide. The slide comes with a colorful pie chart divided into two segments. Each of them represents a specific category or data point. Percentage values are displayed within the chart. It provides viewers with quick insights into the distribution of data. Below the chart, color-coded markings are provided to indicate the corresponding categories represented in the chart. 

    Two nodes are included that allow users to provide detailed descriptions. Ideal for professionals across various industries, including finance, marketing, sales and research. A suitable template to present data analysis, market trends and survey results. Download now to effectively communicate your data insights and make informed decisions with clarity. 

    Features of the template

    • The slide contains 16:9 and 4:3 formats.
    • Compatible with Google slide themes and PowerPoint.
    • 100% customizable slides and easy to download.
    • It is easy to change the colors of the slide quickly.
    • Well-crafted template with an instant download facility.
    Advertisement

    You May Also Like These PowerPoint Templates

    Add to Wishlist
    Download
    AI Customize
    Illustration of a chart with yellow, red, and green horizontal bars displaying percentages and paper boat icons on waves.
    Add to Wishlist
    Download
    AI Customize
    KPI dashboard showcasing private school growth with yellow bar charts indicating critical, low, none, and high levels.
    Add to Wishlist
    Download
    AI Customize
    A vertical green color bar chart slide displaying loss data from 2014 to 2019, with the title at the top.
    Add to Wishlist
    Download
    AI Customize
    Dashboard slide showing colour coded plant growth chart with progress ring visuals and percentages.
    Add to Wishlist
    Download
    AI Customize
    Dashboard slide showing sales bar chart with a highlighted value and a gauge representing business metrics.
    Add to Wishlist
    Download
    AI Customize
    A colorful pie chart diagram with concentric circles showing percentages for different data categories in 2021.
    Add to Wishlist
    Download
    AI Customize
    KPI dashboard layout with blue and green line graphs at the top and shaded bar charts at the bottom in gradient colors.
    Free
    Add to Wishlist
    Download
    AI Customize
    Gantt chart slide showing six tasks with progress bars, each reflecting completion levels ranging from 30% to 80%.
    Add to Wishlist
    Download
    AI Customize
    Annual report slide with five sections of pie chart, bar graphs, and profit figures, in green and blue tones.
    Add to Wishlist
    Download
    AI Customize
    Four orange pie charts with center numbers from 01 to 04, each with text placeholders on the right.
    Free
    Add to Wishlist
    Download
    AI Customize
    Line chart showing traction growth with two labeled data points in green and blue, alongside thumbs up and thumbs down icons.
    Add to Wishlist
    Download
    AI Customize
    Microsoft PowerPoint slide featuring three donut charts in yellow, orange, and pink, each with different percentage values.
    Free
    Add to Wishlist
    Download
    AI Customize
    Line chart template with two data series on a dark background, featuring a calculator and pen in the background.
    Add to Wishlist
    Download
    AI Customize
    KPI Dashboard PPT slide displaying project analysis, revenue, profitability, and gap analysis with data visualizations.
    Add to Wishlist
    Download
    AI Customize
    Business KPI dashboard showcasing charts for real estate and page views with pie, bar, and line graph visualizations.
    Add to Wishlist
    Download
    AI Customize
    Colorful infographic with a line graph, pie and bar chart, and numerical data panels in a structured KPI template design.
    Add to Wishlist
    Download
    AI Customize
    Dashboard template showing sales, orders, visitors, and users metrics with visual bar and pie charts for website analysis.
    Add to Wishlist
    Download
    AI Customize
    Colorful progress bars in rows, showing numbered squares in red, teal, purple, and blue, with text on the right.