Free - Editable Bar Chart PowerPoint And Google Slides Templates

Free
Pack of 13 slides
P.ID : 11409
Advertisement
1.7K+ views
694 Downloads
Get Custom Slides by Experts
Instantly Access Templates in PowerPoint

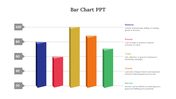
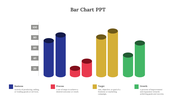
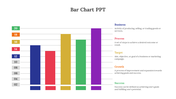
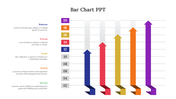
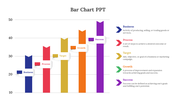
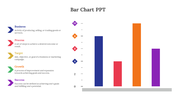
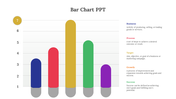
Engage Your Audience with Dynamic Bar Chart PowerPoint Templates


Transform your presentations with our vibrant Bar Chart PowerPoint Template With 13 unique slides, this free PowerPoint template offers a plethora of visually appealing bar chart designs. Each slide is meticulously crafted to capture attention and deliver your data with clarity and impact. Business professionals, students, and anyone seeking to elevate their presentations! Whether you're showcasing financial data, project timelines, or survey results, these templates provide a versatile solution. Simply plug in your data, customize the visuals, and impress your audience effortlessly.

Not only does it offer stunning design elements, but it also enhances comprehension and engagement. Say goodbye to dull, static presentations and hello to dynamic storytelling through data visualization. Elevate your presentations to new heights and leave a lasting impression on your audience. Download our Bar Chart PowerPoint Template today and unleash the power of visual storytelling! Elevate your presentations, engage your audience, and stand out from the crowd!

Features of the template

  • 100% customizable slides and easy to download.
  • Slides are available in different colors
  • The slide has 4:3 and 16:9 formats.
  • Easy to change the slide colors quickly.
  • Appealing Presentation to impress an audience.
  • Create feature-rich slide presentations. 
  • An eye-pleasing color slide helps to give a catchy display.
  • Highly compatible with PowerPoint and Google Slides.

You May Also Like These PowerPoint Templates

Add to Wishlist
Download
AI Customize
KPI dashboard with bar graphs showing data trends over time and two green summary boxes.
Add to Wishlist
Download
AI Customize
Vehicle dashboard slide featuring a speedometer on the left and a detailed table on the right with its brands.
Free
Add to Wishlist
Download
AI Customize
A PPT chart template featuring a table layout with rows labeled Text and columns with bar charts in different shades of blue.
Add to Wishlist
Download
AI Customize
Slide with multiple charts including bar, line, and pie charts illustrating data for hires, turnover, and training.
Free
Add to Wishlist
Download
AI Customize
Visual of project phases and value generation over time, with milestones labeled as planning, detailing, and implementation.
Add to Wishlist
Download
AI Customize
A donut chart with four sections in green, red, and white, labeled with percentages, and text boxes around it.
Free
Add to Wishlist
Download
AI Customize
PPT slide with a blue bar chart showing percentages for the years 2016 to 2021 with a woman standing next to the chart.
Add to Wishlist
Download
AI Customize
Business column chart template showing four bar sections, each representing industries with icons and data percentages.
Add to Wishlist
Download
AI Customize
Business slide with four sections representing different concepts Equality, Human Rights, Independent, and Multi Party.
Add to Wishlist
Download
AI Customize
Executive dashboard with a pie chart, vertical and horizontal bar graph, and a waterfall chart, displaying various data.
Add to Wishlist
Download
AI Customize
Business dashboard featuring a profile card, three financial metrics, a 67% circular chart, and a dual-colored area graph.
Add to Wishlist
Download
AI Customize
A colorful dashboard PowerPoint slide featuring graphs, stats, and a pie chart for a data driven presentation with captions.
Free
Add to Wishlist
Download
AI Customize
Five-step timeline with icons for connectivity, achievement, computers, pie chart, and security, paired with text.
Add to Wishlist
Download
AI Customize
Dashboard PowerPoint slide featuring three speedometer style gauges displaying percentages with a dartboard graphic.
Add to Wishlist
Download
AI Customize
Dashboard with charts and metrics, including pie chart for sales, bar and line charts, and visitor statistics.
Free
Add to Wishlist
Download
AI Customize
Line chart with data points marked by blue squares and black dots, displaying values from 2006 to 2014.
Add to Wishlist
Download
AI Customize
Bar chart with colorful columns of varying heights representing percentages, with social media icons below.
Free
Add to Wishlist
Download
AI Customize
Slide with line and trends charts, showing five columns of data with placeholder text for each chart segment.
Add to Wishlist
Download
AI Customize
3D cone charts in blue shades with percentage labels, showing two datasets with a legend on the right.
Add to Wishlist
Download
AI Customize
Matrix chart with skill and will axes, divided into quadrants labeled high and low, with numbered circles and icons.
Add to Wishlist
Download
AI Customize
PowerPoint chart template displaying three donut charts with percentages and icons representing data categories.
Add to Wishlist
Download
AI Customize
Bar chart presentation showing data from 2017 to 2020, with values 2.4, 4.4, 1.8, and 2.8, respectively.
Free
Add to Wishlist
Download
AI Customize
Horizontal timeline graphic with five purple arrows, labeled captions and date ranges, aligned with a month indicator.
Add to Wishlist
Download
AI Customize
3D pie chart with four color-coded segments red, orange, yellow, and brown displaying percentage values.
Free
Add to Wishlist
Download
AI Customize
Bar chart slide with three stacked bars, each divided into segments with percentage labels, and a table on the right.
Add to Wishlist
Download
AI Customize
Timeline charts slides showcasing different stages and tasks across various projects, with color coded bars for each task.
Free
Add to Wishlist
Download
AI Customize
Slide with four green donut charts and two horizontal bar graphs showing data comparisons across quarters and months.
Free
Add to Wishlist
Download
AI Customize
Illustration of six red bars with corresponding percentages and a businesswoman standing beside them.
Free
Add to Wishlist
Download
AI Customize
Business strategy chart with blue headers for months, showing green bars representing schedules.
Add to Wishlist
Download
AI Customize
Stacked bar chart with four vertical bars showing percentages from 2013, 2014, and 2015 in varying green shades.
Free
Add to Wishlist
Download
AI Customize
Business plan slide showing bar chart comparing impact of society, customer satisfaction, and people satisfaction.
Add to Wishlist
Download
AI Customize
Color-coded bars representing business growth from 2015 to 2019, with a percentage line graph above showing a rise.
Add to Wishlist
Download
AI Customize
Template showcasing various chart designs, including line, bar, pie, and comparison charts across multiple slides.
Add to Wishlist
Download
AI Customize
Creative charts showing a circular 60% approval metric, bar graphs, and a 55% Twitter engagement donut chart.