Free - Creative PowerPoint Bar Chart Templates Presentation

Free
Chart with colorful bars representing yearly data from 2013 to 2020, paired with eight colorful cube icons on the sides.
P.ID : 47110
    1K+ views
    430 Downloads
    Get Custom Slides by Experts
    Instantly Access Templates in PowerPoint

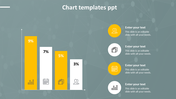
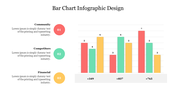
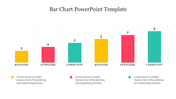
    Multicolor Bar Chart Slide For Presentation 

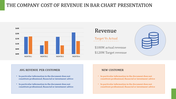
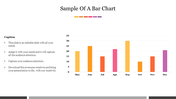
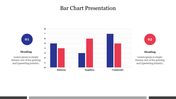
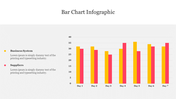
    Why are bar charts so popular? Bar charts are straightforward to understand, and they are versatile too. The bars can be aligned either horizontally or vertically to showcase your data. Isn't that effortless to use? That's why they play a significant role in visualizing many data types in a single take. Our Powerpoint bar chart templates are super cool to use, and they can help you understand how values relate to one another visually. The slide shows you which values have increased the most with its fantastic color tone. We have this readily designed bar chart to represent your data effectively. Get it done with this slide.

    Features of the template 

    • 100% customizable slides and easy to download.
    • Slides are available in different nodes & colors.
    • The slide contained 16:9 and 4:3 formats.
    • Easy to change the slide colors quickly.
    • It is a well-crafted template with an instant download facility.
    • Mind-blowing slide for the PowerPoint.
    • Best presentation slide.
    Advertisement

    You May Also Like These PowerPoint Templates

    Free
    Add to Wishlist
    Download
    AI Customize
    Pie chart illustration showcasing five data segments in varying colors with percentage labels and connected captions areas.
    Add to Wishlist
    Download
    AI Customize
    Vertical Microsoft infographic with four colored arrows each labeled with icons for business, target, analytics, and money.
    Add to Wishlist
    Download
    AI Customize
    Steps to growth slide featuring a chart with four arrows indicating yearly growth percentages and a large text section.
    Add to Wishlist
    Download
    AI Customize
    KPI slide showcasing cash flow metrics and financial performance over six months in different bar chat layouts.
    Free
    Add to Wishlist
    Download
    AI Customize
    Comparison bar chart showing percentage values from 2011 to 2019 for chat and security categories.
    Add to Wishlist
    Download
    AI Customize
    A treasurer’s annual report slide featuring a bar chart and line graph in purple and blue with the title.
    Add to Wishlist
    Download
    AI Customize
    Amazing Dashboard PowerPoint Template And Google Slides
    Add to Wishlist
    Download
    AI Customize
    Slide showcasing four circular progress charts with percentages in alternating teal and black accents.
    Add to Wishlist
    Download
    AI Customize
    Editable KPI Dashboard PowerPoint And Google Slides
    Add to Wishlist
    Download
    AI Customize
    Pie chart highlighting percentages for four steps with a caption areas in a circular layout placed in a grey backdrop.
    Free
    Add to Wishlist
    Download
    AI Customize
    A slide showing a colorful KWL chart with sections for knowledge, inquiry, and learning outcomes with placeholder text.
    Free
    Add to Wishlist
    Download
    AI Customize
    Pie chart presentation slide showing three charts with percentages with text placeholders.
    Free
    Add to Wishlist
    Download
    AI Customize
    Six charts in different formats, including line, pie, bar, and gauge, all in blue and gray, displaying data trends.
    Add to Wishlist
    Download
    AI Customize
    Project management dashboard slide showing colored charts for net worth, sector allocation, and various financial metrics.
    Add to Wishlist
    Download
    AI Customize
    Color coded Gantt chart slide outlining a yearly project timeline with quarterly milestones and description boxes.
    Add to Wishlist
    Download
    AI Customize
    A bar chart with four categories displaying stacked colored bars, representing three series in orange, blue, and red.
    Add to Wishlist
    Download
    AI Customize
    Circular chart with seven pastel colored segments, each with  icons and captions around it.
    Add to Wishlist
    Download
    AI Customize
    Gantt chart slide showing a project timeline with tasks categorized into colorful sections, represented by horizontal bars.
    Add to Wishlist
    Download
    AI Customize
    3D bar chart with green, red, yellow, and blue bars for business metrics, with a percentage indicator on the right.