Editable Chart Templates PPT PowerPoint Presentation

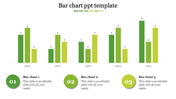
Detailed Chart PPT Templates with Four Nodes
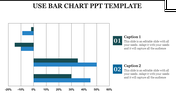
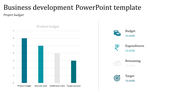
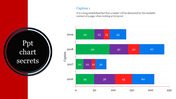
Charts can help you to make complicated data sets more easily understood and can help to illustrate relationships between different data points. Our template is perfect for presenting complex data with clarity and ease. You can quickly create a compelling look and feel that will help your audience pinpoint the key details of the data in a visually captivating way. Also, our template includes various customizing options to help you adjust the chart's color and size, saving you time and effort. With a few simple clicks, you can customize the chart's look and feel to accentuate essential points while ensuring your presentation maintains a consistent professional look.
Features of the template
- 100% customizable slides and easy-to-download
- Slides are available in different nodes & colors.
- The slides contain 16:9 and 4:3 formats.
- It comes with four icons.
- Easy to change the slide colors quickly.
- It is a well-crafted template with an instant download facility.
- We designed this slide with a stunning design.
- You can use this in Microsoft PowerPoint.


You May Also Like These PowerPoint Templates
Add to Wishlist
Download
Edit

Add to Wishlist
Download
Edit

Add to Wishlist
Download
Edit

Add to Wishlist
Download
Edit

Add to Wishlist
Download
Edit

Add to Wishlist
Download
Edit

Add to Wishlist
Download
Edit

Add to Wishlist
Download
Edit


Add to Wishlist
Download
Edit


Add to Wishlist
Download
Edit


Add to Wishlist
Download
Edit

Add to Wishlist
Download
Edit

Add to Wishlist
Download
Edit


Add to Wishlist
Download
Edit
