Free - Bar Chart PowerPoint Template Presentation and Google Slides
Free

Elevate Your Presentations with our Bar Chart PowerPoint Template
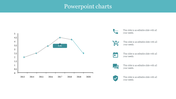
Looking to elevate your presentations with captivating visuals? Introducing our dynamic Bar Chart PowerPoint template! Dive into data visualization with ease as our meticulously crafted slides effortlessly convey trends from 2016 to 2021 with three distinct blue bars for each year, all set against a clean white background.
Our template isn't just for analysts or executives; it's a versatile tool tailored for business professionals, students, and anyone seeking impactful presentations. Seamlessly illustrate financial reports, market trends, or academic research with clarity and precision. Whether you're a seasoned presenter or a novice, our user-friendly design ensures hassle-free customization, allowing you to focus on delivering compelling content. Transform your data into compelling narratives and leave a lasting impression on your audience. Elevate your presentations today with our Bar Chart PowerPoint template—where data meets design! Download now and take your slides to the next level!
Features of the template
- 100% customizable slides and easy to download.
- Slides are available in different colors
- The slide has 4:3 and 16:9 formats.
- Easy to change the slide colors quickly.
- Appealing Presentation to impress an audience.
- Create feature-rich slide presentations.
- An eye-pleasing color slide helps to give a catchy display.
- Highly compatible with PowerPoint and Google Slides.


You May Also Like These PowerPoint Templates
Add to Wishlist
Download
AI Customize

Free
Add to Wishlist
Download
AI Customize


Add to Wishlist
Download
AI Customize

Add to Wishlist
Download
AI Customize

Free
Add to Wishlist
Download
AI Customize

Add to Wishlist
Download
AI Customize

Add to Wishlist
Download
AI Customize

Add to Wishlist
Download
AI Customize

Add to Wishlist
Download
AI Customize

Add to Wishlist
Download
AI Customize

Add to Wishlist
Download
AI Customize


Add to Wishlist
Download
AI Customize

Add to Wishlist
Download
AI Customize

Add to Wishlist
Download
AI Customize

Add to Wishlist
Download
AI Customize

Add to Wishlist
Download
AI Customize

Add to Wishlist
Download
AI Customize

Add to Wishlist
Download
AI Customize
