Practical Analysis Report Template Slide With Eight Nodes

Analysis report template featuring a purple and green area graph comparing five projects, with separate information
P.ID : 60886
    37 views
    2 Downloads
    Get Custom Slides by Experts
    Instantly Access Templates in PowerPoint

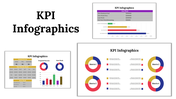
    Present Your Analysis Report With This Chart PowerPoint Template

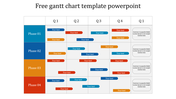
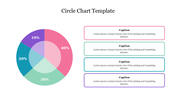
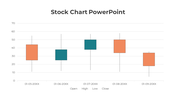
    Give a detailed explanation about your Analysis Report and graph with this Analysis Report Template. There are two nodes presented in this template and a colorful chart to convey your Analysis details to the audience. Below the graph diagram, you can give the project name of each node's facts.

    Never miss this Analysis Report Template in your business Analysis PowerPoint presentation. Notice the two text boxes on the right side of the chart diagram, which look attractive. In addition, the font styles are crystal clear, which can be viewed even by the person sitting in the last row.

    Features of this template

    • This template is 100% editable(shape color, size & text)
    • This template has a chart theme.
    • Drag and drop image placeholder
    • Huge Collections of Analysis slides to impress your audience
    • It supports an aspect ratio of 4:3
    • Easily readable and acceptable template.
    Advertisement

    You May Also Like These PowerPoint Templates

    Add to Wishlist
    Download
    AI Customize
    Line chart template with two lines and labeled data points, along with caption blocks on the left.
    Add to Wishlist
    Download
    AI Customize
    A green circular pie chart showing percentage, and four colored sales data graphs for different years.
    Add to Wishlist
    Download
    AI Customize
    A line graph showing a plot structure with key points marked by colored dots, representing key stages.
    Add to Wishlist
    Download
    AI Customize
    SEO marketing plan template with icons representing different elements like e-commerce, email, and global marketing.
    Add to Wishlist
    Download
    AI Customize
    A donut chart with multiple segments in different colors next to a table displaying statistics and percentage changes.
    Free
    Add to Wishlist
    Download
    AI Customize
    Slide deck showcasing KWL chart layouts with colorful sections in purple, yellow, and teal, for structured insights.
    Add to Wishlist
    Download
    AI Customize
    Chart guide slide with two green-tone line graphs displaying data points, captions on the right, and a text footer.
    Add to Wishlist
    Download
    AI Customize
    KPI slide showcasing cash flow metrics and financial performance over six months in different bar chat layouts.
    Free
    Add to Wishlist
    Download
    AI Customize
    Comparison bar chart showing percentage values from 2011 to 2019 for chat and security categories.
    Add to Wishlist
    Download
    AI Customize
    A treasurer’s annual report slide featuring a bar chart and line graph in purple and blue with the title.
    Add to Wishlist
    Download
    AI Customize
    Infographic bar chart slide displaying daily comparisons for Business System and Supplier metrics.
    Add to Wishlist
    Download
    AI Customize
    Amazing Dashboard PowerPoint Template And Google Slides
    Add to Wishlist
    Download
    AI Customize
    Editable KPI Dashboard PowerPoint And Google Slides
    Add to Wishlist
    Download
    AI Customize
    Comparison chart with horizontal green bars displaying data for four examples across three series.
    Free
    Add to Wishlist
    Download
    AI Customize
    A slide showing a colorful KWL chart with sections for knowledge, inquiry, and learning outcomes with placeholder text.
    Free
    Add to Wishlist
    Download
    AI Customize
    Pie chart presentation slide showing three charts with percentages with text placeholders.
    Free
    Add to Wishlist
    Download
    AI Customize
    Six charts in different formats, including line, pie, bar, and gauge, all in blue and gray, displaying data trends.
    Free
    Add to Wishlist
    Download
    AI Customize
    Presentation slide layout illustrating key elements for high quality PowerPoint including steps with icons.
    Add to Wishlist
    Download
    AI Customize
    Project management dashboard slide showing colored charts for net worth, sector allocation, and various financial metrics.