MILESTONE 🌟 5 Million+ creative minds trust SlideEgg! Grab 80% OFF

System Analysis And Design Presentation And Google Slides

Pack of 13 slides
P.ID : 75754
Advertisement
1 views
1 Downloads
Get Custom Slides by Experts
Enhance Your Presentations with Add-ins
Google Slides Add-in
Access templates directly in Google Slides
Microsoft PowerPoint Add-in
Access templates directly in PowerPoint
GPT Add-on
AI-powered presentation assistance

System Analysis And Design PPT, Google Slides, and Canva Template


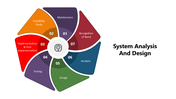
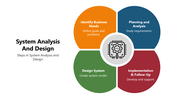
Systems Analysis and Design (SAD) is a structured process for developing and maintaining information systems. This presentation highlights how SAD methodologies make systems more efficient, effective, and aligned with business needs. It is designed to simplify the topic and make it easier to understand.

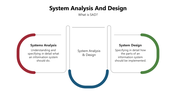
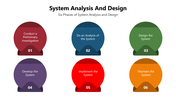
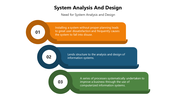
This 13-slide deck PowerPoint, Google Slides, and Canva template is designed to make the concept of Systems Analysis and Design easy to explain and understand. It covers essential components, including the key phases: Analysis, Design, Implementation, and Maintenance. The template also includes simple visual elements and thought-provoking questions such as: What is the primary purpose of a feasibility study? How do system analysis and design differ? These features encourage interactive sessions and enhance knowledge retention.

Business analysts, IT project managers, software developers, educators, and students in technology can use this template for corporate training, project proposals, or academic lectures. The slides are fully editable and well-structured, making them suitable for professional seminars, team meetings, or classroom discussions.

Download this System Analysis and Design template now to create impactful, informative presentations that simplify complex project methodologies and enhance your IT development process.

Features of this template


  • 100% customizable slides and easy to download.
  • The slides contain 16:9 and 4:3 formats.
  • Easy to change the colors quickly.
  • Highly compatible with PowerPoint, Google Slides, and Canva templates.

You May Also Like These PowerPoint Templates

Add to Wishlist
Download
AI Customize
Hexagon layout with captions in teal, blue, and pink, connected to numbered nodes on a dotted gray background.
Add to Wishlist
Download
AI Customize
Slide with an orange upright and a purple inverted triangle, each featuring icons and four numbered captions around them.
Free
Add to Wishlist
Download
AI Customize
Vertical bar chart with five captions and a magnifying glass highlighting one, and numbered list with text on the right.
Add to Wishlist
Download
AI Customize
Pack of slides with colorful icons and sections for various data analysis, including visuals and layouts.
Free
Add to Wishlist
Download
AI Customize
Competitor analysis chart slide comparing four companies across various categories.
Add to Wishlist
Download
AI Customize
Market analysis infographic with a yellow open box at the bottom, connected to four colored captions labeled 1 to 4.
Add to Wishlist
Download
AI Customize
A market analysis slide featuring visual data representation with charts illustrating quantitative statistics with captions.
Free
Add to Wishlist
Download
AI Customize
Add to Wishlist
Download
AI Customize
 slide featuring three circular charts for data analysis, followed by a line chart displaying monthly trends.
Add to Wishlist
Download
AI Customize
Performance slide with four quadrants in red, green, teal, and blue, connected in a circular flow with relevant text.
Add to Wishlist
Download
AI Customize
Financial slide deck with a navy blue theme, featuring sections on company mission, analysis types, and team profiles.
Add to Wishlist
Download
AI Customize
Five numbered hexagons in red, orange, green, teal, and blue, each with text inside.
Add to Wishlist
Download
AI Customize
Magnifying glass with two speech bubbles on the left and four colored analysis sections with checkmark icons on the right.
Add to Wishlist
Download
AI Customize
Infographic showing seven-step performance cycle in a circular layout, each step marked with colored numbers and labels.
Add to Wishlist
Download
AI Customize
Slide featuring five colorful cylindrical bar charts labeled with data analytics categories with percentages from 23% to 75%.