Data Analytics PowerPoint Templates and Google Slides

Slide featuring five colorful cylindrical bar charts labeled with data analytics categories with percentages from 23% to 75%.
P.ID : 3913
    4.2K+ views
    506 Downloads
    Get Custom Slides by Experts
    Instantly Access Templates in PowerPoint

    Data Analytics Presentation Slide


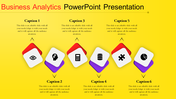
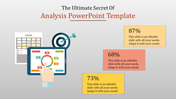
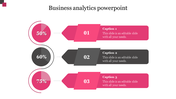
    Data analytics is the process of examining and interpreting large sets of data to uncover insights and patterns. It's like a treasure hunt for valuable information that can lead to better decisions and outcomes. Slide Egg has created this colorful slide that visually represents the percentage levels to demonstrate the data analytics in an easily digestible way. It's like a magic trick that transforms numbers into meaningful and actionable insights. So why can't you give a try to make a successful presentation.

    Features of the template:

    • 100% customizable slides and easy to download.
    • It can be used in powerpoint and google slide.
    • The slide contains 16:9 and 4:3 formats.
    • Easy to change the slide colors quickly.
    • Well-crafted template with instant download facility.
    • The best tool to visualize your data analysis.
    • The multi-color graphics will make your presentation engaging.
    Advertisement

    You May Also Like These PowerPoint Templates

    Add to Wishlist
    Download
    AI Customize
    Linear timeline showing red triangular nodes connected by dots, each node containing an icon and caption.
    Add to Wishlist
    Download
    AI Customize
    Attractive Business Analytics PowerPoint Template Design
    Add to Wishlist
    Download
    AI Customize
    Business analysis slide with a central pink gradient circle surrounded by  six colorful icons with text, on a gray backdrop.
    Add to Wishlist
    Download
    AI Customize
    A person working on a laptop with analysis data, alongside bar charts with percentage and text box, on a gray background.
    Add to Wishlist
    Download
    AI Customize
    Colorful SOAR Model PowerPoint slide with circles and icons with strength, opportunities, aspirations, and results.
    Add to Wishlist
    Download
    AI Customize
    Analytics slide with line graph, pie chart, and statistics showing 13M views, 13M active subscribers, and 991K subscribers.
    Add to Wishlist
    Download
    AI Customize
    Performance PPT And Google Slides Themes For Your Needs
    Add to Wishlist
    Download
    AI Customize
    Market analysis PowerPoint slide featuring a pie chart with labeled segments and captions for each market category.
    Add to Wishlist
    Download
    AI Customize
    Analysis presentation slide showing a technology growth chart with percentage values and icons with placeholder text.
    Free
    Add to Wishlist
    Download
    AI Customize
    Best Scenario Analysis Presentation Template Slides
    Add to Wishlist
    Download
    AI Customize
    Five 3D cylinders in gradient colors, increasing in height, with captions numbered 01 to 05 on the left.
    Add to Wishlist
    Download
    AI Customize
    Strategic growth plan slide with five cylinders in varying colors, each labeled with percentages from 20% to 100%.
    Add to Wishlist
    Download
    AI Customize
    Five-level cylinder chart with arrows and caption areas illustrating progression, displayed in an ascending order of size.
    Add to Wishlist
    Download
    AI Customize
    Two vertical red cylinders with silver tops and bases, each with an icon and text, placed on a gradient blue background.
    Add to Wishlist
    Download
    AI Customize
    Color coded timeline with four points along a curved path, each linked to a date label and placeholder text areas.
    Add to Wishlist
    Download
    AI Customize
    3D infographic with vertical cylinders in blue, red, green, and purple, each paired with icons and descriptive text.