Simple Analytics PowerPoint Template And Google Slides Themes

Analytics PowerPoint template featuring four sections Traffic Source Analysis to Content Analysis in green with icons.
P.ID : 23175
    177 views
    7 Downloads
    Get Custom Slides by Experts
    Instantly Access Templates in PowerPoint

    Unlock Analytics PowerPoint Template


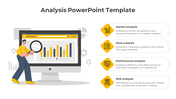
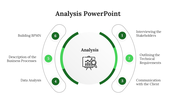
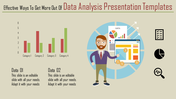
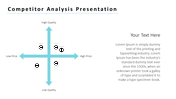
    Enhance your digital strategy with our dynamic Web Analytics template, boasting a refreshing green color theme and four insightful options. Whether you're a digital marketer, web developer, or business analyst, this template provides a visually captivating platform to analyze and optimize your website's performance. Each option meticulously guides you through the process of data collection and interpretation, empowering you to make informed decisions that drive online success. Elevate your understanding and seize the opportunity to unlock actionable insights that propel your business forward! Download our Web Analytics templates and Google Slides Themes now and embark on a journey towards digital excellence. Let each slide guide you towards informed decisions and sustainable progress.

    Features of this template

    • 100% customizable slides and easy to download.
    • The slide contains 16:9 and 4:3 formats.
    • Easy to change the colors of the slide quickly.
    • Highly compatible with PowerPoint and Google Slides.
    Advertisement

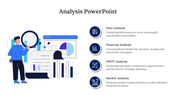
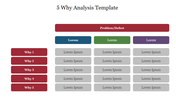
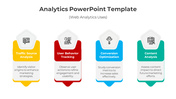
    You May Also Like These PowerPoint Templates

    Add to Wishlist
    Download
    AI Customize
    Banking data analysis slide with green bar chart on a computer screen and three listed issues in circles on the right.
    Add to Wishlist
    Download
    AI Customize
    Data analysis slide with a monitor showing analytics icons, and five colorful speech bubbles indicating various steps around it.
    Add to Wishlist
    Download
    AI Customize
    Slide with a blue sidebar featuring a document icon, two captions in yellow and orange circles, and text at bottom.
    Add to Wishlist
    Download
    AI Customize
    Analysis slide featuring a magnifying glass over banana, with three circular progress charts in green, orange, and yellow.
    Add to Wishlist
    Download
    AI Customize
    Four staggered colored bars in blue, green, yellow, and purple with icons and captions aligned horizontally.
    Add to Wishlist
    Download
    AI Customize
    Stakeholder analysis slide showing a group of professionals discussing laptops in a meeting room.
    Add to Wishlist
    Download
    AI Customize
    Central speedometer icon with curved black line and five connected colored circles linking labeled sections.
    Add to Wishlist
    Download
    AI Customize
    Four hexagons in red, blue, yellow, and green, each with a relevant financial icon and captions around it.
    Add to Wishlist
    Download
    AI Customize
    Three segmented semi circular diagram in blue tones with icons, and a black magnifying glass overlaying a head symbol.
    Free
    Add to Wishlist
    Download
    AI Customize
    Vertical bar chart with five captions and a magnifying glass highlighting one, and numbered list with text on the right.
    Free
    Add to Wishlist
    Download
    AI Customize
    Business slide with two numbered green markers, a magnifying glass over coins, and a group of people analyzing a chart.
    Add to Wishlist
    Download
    AI Customize
    Pricing table layout with three columns labeled with subscription, in a red and white color scheme.
    Add to Wishlist
    Download
    AI Customize
    Slide featuring four circular progress charts in yellow, pink, blue, and green, with captions on a gray background.
    Add to Wishlist
    Download
    AI Customize
    Analysis PowerPoint template featuring four colorful stages from data interpretation to risk Assessment with icons.
    Add to Wishlist
    Download
    AI Customize
    Three head silhouettes in blue and gray with icons, connected by arrows with captions below, on a white background.
    Add to Wishlist
    Download
    AI Customize
    Analysis PowerPoint template displaying a blue circular diagram with steps from interviewing stakeholders to building BPMN.
    Add to Wishlist
    Download
    AI Customize
    Analysis report template featuring a purple and green area graph comparing five projects, with separate information