Optimize Analysis PowerPoint And Google Slides Template

Analysis template with a man looking through a magnifying glass at a computer screen with four types and caption areas.
P.ID : 143
    2.5K+ views
    299 Downloads
    Get Custom Slides by Experts
    Instantly Access Templates in PowerPoint

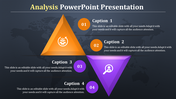
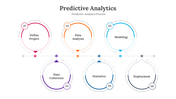
    Analysis PowerPoint Template


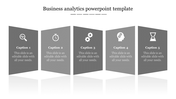
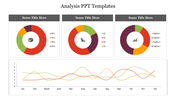
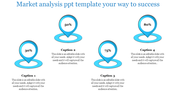
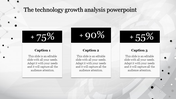
    Analysis involves examining data to uncover insights, trends, or patterns for informed decision-making. Analysts, researchers, and data scientists use it to extract meaningful insights, while managers rely on it for strategy development. Professionals across industries like finance, marketing, and healthcare use analysis to optimize processes and mitigate risks. The analysis PPT template typically includes charts, graphs, and tables to visualize data, along with tools like statistical software for analysis. It should be flexible to accommodate various data types and methodologies while ensuring clarity in presenting results.

    Features of this template


    • 100% customizable slides and easy to download.
    • The slide contains 16:9 and 4:3 formats.
    • Easy to change the colors of the slide quickly.
    • Highly compatible with PowerPoint and Google Slides.
    Advertisement

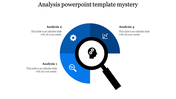
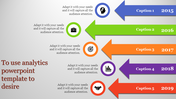
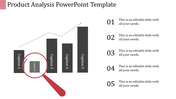
    You May Also Like These PowerPoint Templates

    Add to Wishlist
    Download
    AI Customize
    Three head silhouettes in blue and gray with icons, connected by arrows with captions below, on a white background.
    Add to Wishlist
    Download
    AI Customize
    Analysis PowerPoint template displaying a blue circular diagram with steps from interviewing stakeholders to building BPMN.
    Add to Wishlist
    Download
    AI Customize
    Six oval elements in gray with icons and labels for analysis categories placed in white backdrop.
    Add to Wishlist
    Download
    AI Customize
    Modern design featuring a circular orange arc in the center, flanked by six numbered steps on curved paths on both sides.
    Add to Wishlist
    Download
    AI Customize
    Three vertical blocks in yellow, blue, and green, each with numbers and business analytics icons on a light background.
    Add to Wishlist
    Download
    AI Customize
    A pack of DESC model slides with four elements in various colorful layout designs with text descriptions.
    Add to Wishlist
    Download
    AI Customize
    Circular flowchart with colored arrows in blue, purple, orange, and yellow, pointing to icons and text areas beneath.
    Add to Wishlist
    Download
    AI Customize
    Four step layout with colored tabs in orange, blue, green, and purple, featuring icons and white text boxes.
    Add to Wishlist
    Download
    AI Customize
    A strategic analysis format diagram with a triangle structure representing political, economic, and technological factors.
    Add to Wishlist
    Download
    AI Customize
    Square infographic with four curved arrows in blue, green, orange, and teal, arranged in a cycle for situation analysis.
    Add to Wishlist
    Download
    AI Customize
    Capability Gap PowerPoint And Google Slides Template
    Add to Wishlist
    Download
    AI Customize
    Structured analytics template with blue visuals and pentagonal icons illustrating three data tracking elements.
    Add to Wishlist
    Download
    AI Customize
    Analytics PPT slide showing web analytics uses from traffic source analysis to conversion optimization with icons.
    Add to Wishlist
    Download
    AI Customize
    SWOT diagram with curved arrows in blue, purple, orange, and yellow, pointing to each quadrant.
    Add to Wishlist
    Download
    AI Customize
    Get Involved Observation PowerPoint Template Design
    Add to Wishlist
    Download
    AI Customize
    Analysis themed PowerPoint template with a colorful magnifying glass, document icon, and sections for captions.