Editable Analysis PPT,Google Slides And Canva Template

Analysis PowerPoint template displaying a blue circular diagram with steps from interviewing stakeholders to building BPMN.
P.ID : 26676
    173 views
    12 Downloads
    Get Custom Slides by Experts
    Instantly Access Templates in PowerPoint

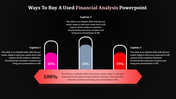
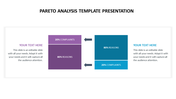
    Analysis Presentation Template


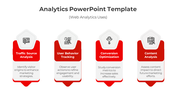
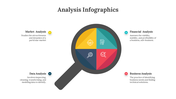
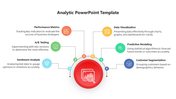
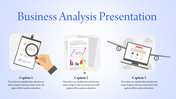
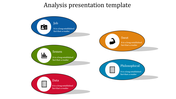
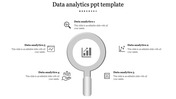
    Craft an Engaging presentation with our Analysis PowerPoint template. This slide features Six blue ovals. The text boxes. It’s a framework used to analyze a business or project by identifying its internal strengths and weaknesses, as well as external opportunities and threats. Whether you're presenting market research, financial reports, or academic data, this template provides the perfect canvas for your insights.

    Business analysts, researchers, educators, marketers, and students can all benefit from this versatile template. Simply download the template, input your data into the editable elements, customize the colors and fonts to match your branding, and present your analysis in a clear, professional, and engaging manner.


    Why Use This Template:

    Professional Design: Impress your audience with clean, polished, and visually appealing slides.

    Ease of Use: Save time with pre-designed elements that are easy to customize.

    Download our analysis PowerPoint templates today and transform your data into compelling stories.

    Features of the template:


    •  Slides are available in 4:3 & 16:9
    • Get slides that are 100% customizable and easy to download
    • Highly compatible with PowerPoint and Google Slides
    Advertisement

    You May Also Like These PowerPoint Templates

    Add to Wishlist
    Download
    AI Customize
    Illustration of a woman analyzing colorful bar and pie charts, with three color coded circular icons on the right.
    Add to Wishlist
    Download
    AI Customize
    Five numbered interconnected puzzle pieces in red, green, purple, teal, and blue, with human illustrations above.
    Add to Wishlist
    Download
    AI Customize
    Vibrant PESTLE chart dividing political, economic, social, technological, legal, and environmental aspects.
    Add to Wishlist
    Download
    AI Customize
    Analysis template with a man looking through a magnifying glass at a computer screen with four types and caption areas.
    Add to Wishlist
    Download
    AI Customize
    Step-by-step analysis diagram with a central focus on analysis, flanked by six green-highlighted steps.
    Add to Wishlist
    Download
    AI Customize
    Data analytics layout featuring a central gray magnifying glass and three orange icons linked to labeled sections.
    Add to Wishlist
    Download
    AI Customize
    Molecular-style infographic with interconnected colored nodes linked to six labeled captions for analysis ideas.
    Add to Wishlist
    Download
    AI Customize
    Central hexagonal shape with multicolor triangles around and two text areas with bar chart and coin stack with percentages.
    Add to Wishlist
    Download
    AI Customize
    Business Analytics slide featuring three stages with icons representing question, insight, and growth.
    Add to Wishlist
    Download
    AI Customize
    Data analysis template with a bar graph and illustrated dashboard layout with two caption areas for data.
    Add to Wishlist
    Download
    AI Customize
    Illustration of a person analyzing charts in blue accents, with four analysis types listed on the right.
    Add to Wishlist
    Download
    AI Customize
    Grid layout with five red boxes for why labels and three columns in blue, green, and purple for answers.
    Add to Wishlist
    Download
    AI Customize
    Four colorful vertical banners in yellow, red, blue, and green with icons, title, and descriptions for web analytics uses.
    Add to Wishlist
    Download
    AI Customize
    Data analysis featuring icons for data interpretation, market research, and performance evaluation.
    Add to Wishlist
    Download
    AI Customize
    Competitor analysis chart with four quadrants representing high and low price and quality, showing competitor circles.
    Free
    Add to Wishlist
    Download
    AI Customize
    Amazing Business Analytics PPT Templates and Google Slides
    Add to Wishlist
    Download
    AI Customize
     slide featuring three circular charts for data analysis, followed by a line chart displaying monthly trends.
    Add to Wishlist
    Download
    AI Customize
    Banking data analysis slide with green bar chart on a computer screen and three listed issues in circles on the right.
    Add to Wishlist
    Download
    AI Customize
    Data analysis slide with a monitor showing analytics icons, and five colorful speech bubbles indicating various steps around it.
    Add to Wishlist
    Download
    AI Customize
    Slide with a blue sidebar featuring a document icon, two captions in yellow and orange circles, and text at bottom.