Analytics PowerPoint Templates And Google Slides

Circular infographic with a central globe icon connected to eight color-coded nodes for analytics techniques.
P.ID : 9111
    13 slides
    Marketing analytics slides with yellow, green, and teal blocks highlighting customer segmentation and data tools.
    11 slides
    Slide deck covering hypothesis testing, with a central six-step process diagram and supporting slides in a white background.
    11 slides
    Flowchart with icons representing predictive analytics elements below with detail analytics processes and value chains.
    13 slides
    3C analysis slides with various triangle shaped layouts in vibrant colors representing company, customers, and competitors.
    11 slides
    Reflective learning slide deck with four colored sections for different types of thinking, centered around a book icon.
    11 slides
    Slide deck with colorful layouts around a central icon, highlighting various aspects of social impact assessment.
    13 slides
    Data analysis slides with flowcharts, icons, and colored segments for statistical methods and machine learning algorithms.
    779 views
    54 Downloads
    Get Custom Slides by Experts
    Instantly Access Templates in PowerPoint

    Editable Data Storytelling PPT Template


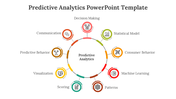
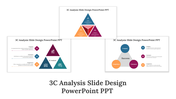
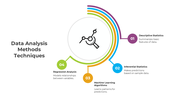
    With our Analytics PowerPoint Template, you don’t just provide numbers; you are weaving a story of insights and opportunities, research turned into a methodological story. This analysis slide is clear and accurate. The focal point of the design is a golden ratio-inspired documentary surrounded by colors representing data points or metrics. Each icon offers customizable text boxes for individual headings that allow you to accurately and elegantly communicate your unique research insights.


    Whether you’re an expert, a curious student, or a data enthusiast, this template caters to everyone. The documentary beautifully distills complex data into digestible chunks. It’s like turning a maze into a beautiful tunnel—easy to navigate, but packed with features. Our template is user-friendly. Change colors, fonts, and content effortlessly. Let each data point capture your audience. Click below to see these Analytics PowerPoint Templates and Google Slides Themes.


    Features of the template:


    • Slides are available in 4:3 & 16:9
    • Well-crafted template with instant download.
    • Get slides that are 100% customizable and easy to download
    Advertisement

    You May Also Like These PowerPoint Templates

    Add to Wishlist
    Download
    AI Customize
    Collection of slides showing different styles like diamonds, hexagons, and flowcharts, with ethical principles.
    Add to Wishlist
    Download
    AI Customize
    Slide with five numbered colorful arrows with text area on the left, and a pie chart highlighting observation
    Add to Wishlist
    Download
    AI Customize
    A structured 8D analysis slide featuring eight distinct steps, each labeled with a numbered blue bar.
    Add to Wishlist
    Download
    AI Customize
    5C analysis slide deck with various colorful layouts explaining the company, customers, competitors, collaborators, context.
    Add to Wishlist
    Download
    AI Customize
    The data analysis slide has large text, a variety of icons above a person's silhouette, and color options at the bottom.
    Add to Wishlist
    Download
    AI Customize
    Colorful graphic showcasing a situation analysis framework with six labeled sections around a central analysis icon.
    Add to Wishlist
    Download
    AI Customize
    Detailed ISO 9001 gap analysis table, outlining requirements and corrective action processes for nonconformities.
    Add to Wishlist
    Download
    AI Customize
    Colorful circular diagram slide illustrating a situation analysis framework with captions for four categories with icons.
    Add to Wishlist
    Download
    AI Customize
    Slide deck outlining the change readiness assessment process, with four color coded phases and corresponding steps.
    Add to Wishlist
    Download
    AI Customize
    Editable Company Analysis PowerPoint And Google Slides
    Add to Wishlist
    Download
    AI Customize
    PowerPoint slide for Pareto analysis with two circular diagrams showing reasons and complaints in percentages.
    Add to Wishlist
    Download
    AI Customize
    Content Analysis PowerPoint And Google Slides Themes
    Add to Wishlist
    Download
    AI Customize
    Organizational assessment slide deck highlighting mission at the center, surrounded by four elements with level indicators.
    Add to Wishlist
    Download
    AI Customize
    Category analysis slide featuring six colored boxes each with bullet points.
    Add to Wishlist
    Download
    AI Customize
    Customer analytics slide deck with five diamond icons representing steps from customer experience to data collection.
    Add to Wishlist
    Download
    AI Customize
    Slide with two columns in red and blue, each with three rectangular boxes, connected to a central circular icon.