Stunning Data Analysis Methods PPT And Google Slides

Data Analysis Methods Presentation Slides
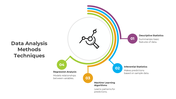
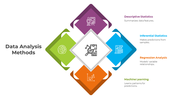
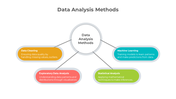
Engaging in Data Analysis PPT Methods allows individuals to scrutinize raw data, extracting valuable insights for informed decision-making. It encompasses a range of techniques, from statistical methods to qualitative approaches, uncovering patterns and correlations within datasets.
This proficiency empowers professionals to unlock the full potential of their data, driving progress and innovation across various fields. The Change Management PowerPoint template, tailored for change leaders and professionals, proves indispensable for navigating complex transitions and driving organizational change. It offers a structured framework for articulating change strategies, engaging stakeholders, and tracking progress.
Featuring a user-friendly interface and fully editable slides, it empowers presenters to lead change initiatives with confidence. By streamlining the communication of intricate Change Management concepts, this template saves time and ensures impactful presentations.
Equip your team with this valuable resource, guiding them through organizational transitions with confidence and competence, ultimately leading to a future of growth and adaptability. Elevate your presentations with this versatile and visually engaging template today.
Features of the templates:
- 100% customizable slides and easy to download.
- Slides are available in different nodes & colors.
- The slide contained 16:9 and 4:3 formats.
- Easy to change the slide colors quickly.
- It is a well-crafted template with an instant download facility.


You May Also Like These PowerPoint Templates
Add to Wishlist
Download
Edit

Add to Wishlist
Download
Edit

Add to Wishlist
Download
Edit

Add to Wishlist
Download
Edit

Add to Wishlist
Download
Edit

Add to Wishlist
Download
Edit

Add to Wishlist
Download
Edit

Add to Wishlist
Download
Edit

Add to Wishlist
Download
Edit

Add to Wishlist
Download
Edit

Add to Wishlist
Download
Edit

Add to Wishlist
Download
Edit

Add to Wishlist
Download
Edit

Add to Wishlist
Download
Edit

Add to Wishlist
Download
Edit

Add to Wishlist
Download
Edit

Add to Wishlist
Download
Edit

Add to Wishlist
Download
Edit

Add to Wishlist
Download
Edit

Add to Wishlist
Download
Edit

Add to Wishlist
Download
Edit

Add to Wishlist
Download
Edit

Add to Wishlist
Download
Edit

Add to Wishlist
Download
Edit

Add to Wishlist
Download
Edit

Add to Wishlist
Download
Edit

Add to Wishlist
Download
Edit

Add to Wishlist
Download
Edit

Add to Wishlist
Download
Edit

Add to Wishlist
Download
Edit

Add to Wishlist
Download
Edit


Add to Wishlist
Download
Edit

Add to Wishlist
Download
Edit

Add to Wishlist
Download
Edit

Add to Wishlist
Download
Edit
