Best Analytics PowerPoint Template and Google Slides

 Canva
Canva
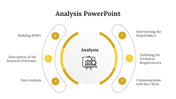
Analytics PowerPoint Template and Google Slides Themes
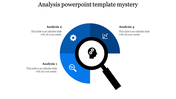
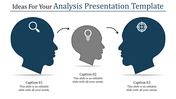
The Analytics PowerPoint and Google Slides theme is sleek and professional, using blue and black colors against a clean white background. It's perfect for a variety of analytics-related presentations covering topics like Data Visualization, Decision Making, Performance Evaluation, and more.
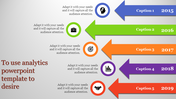
There's plenty of space for your title and text, giving you a structured layout to share your analytical insights, strategies, and performance metrics effectively. The color scheme adds a touch of sophistication, making your presentation look polished and professional.
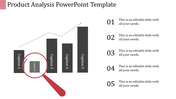
Whether you're creating business reports, analyzing data, or discussing analytics strategies, this template is versatile and impactful. You can customize it to match your branding and presentation style, making it perfect for internal meetings, client presentations, or academic seminars.
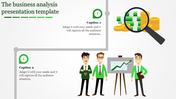
With the Analytics PowerPoint and Google Slides theme, you have a professional and visually compelling tool to present your analytics-related content with clarity and precision.
Features of the template
- 100% customizable slides and easy to download.
- Slides are available in different nodes & colors.
- The slide contains 16:9 and 4:3 formats.
- It is easy to change the colors of the slide quickly.
- Well-crafted template with an instant download facility.


You May Also Like These PowerPoint Templates
Add to Wishlist
Download
Edit

Add to Wishlist
Download
Edit

Add to Wishlist
Download
Edit

Add to Wishlist
Download
Edit

Add to Wishlist
Download
Edit

Add to Wishlist
Download
Edit

Add to Wishlist
Download
Edit

Add to Wishlist
Download
Edit

Add to Wishlist
Download
Edit

Add to Wishlist
Download
Edit

Add to Wishlist
Download
Edit

Add to Wishlist
Download
Edit

Add to Wishlist
Download
Edit

Add to Wishlist
Download
Edit

Add to Wishlist
Download
Edit

Add to Wishlist
Download
Edit

Add to Wishlist
Download
Edit

Add to Wishlist
Download
Edit

Add to Wishlist
Download
Edit

Add to Wishlist
Download
Edit
