Advanced Business Analytics PowerPoint for Data Insights

Three vertical blocks in yellow, blue, and green, each with numbers and business analytics icons on a light background.
P.ID : 16000
    129 views
    6 Downloads
    Get Custom Slides by Experts
    Instantly Access Templates in PowerPoint

    Business Analytics PowerPoint Template and Google Slides


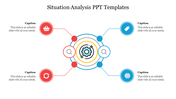
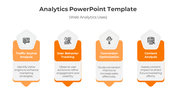
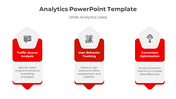
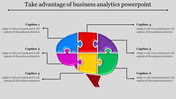
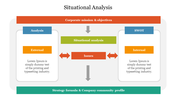
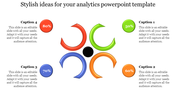
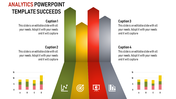
    Empower your business analysis endeavors with our dynamic Business Analytics template. Featuring three vibrant bars reminiscent of bricks, each adorned with an icon and accompanied by a dedicated text box, this template offers a visually engaging platform to dissect and interpret your business data. 

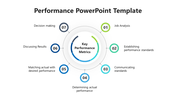
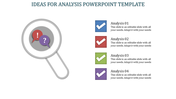
    Whether you're examining market trends, assessing performance metrics, or evaluating strategic initiatives, this template allows you to distill complex information into clear and compelling insights. By presenting your findings in a simple and memorable format, you can effectively communicate your analysis to stakeholders and drive informed decision-making. With its colorful design and intuitive layout. 

    Our Business Analytics template transforms data analysis into an engaging visual narrative, helping you captivate your audience and leave a lasting impression. Elevate your business presentations and unlock the potential of your data with this versatile and impactful template.

    Features of the template

    • 100% customizable slides and easy to download.
    • Slides are available in different nodes & colors.
    • The slide contains 16:9 and 4:3 formats.
    • It is easy to change the colors of the slide quickly. 
    • Well-crafted template with an instant download facility.
    Advertisement

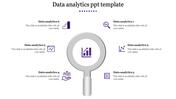
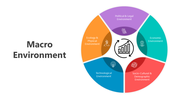
    You May Also Like These PowerPoint Templates

    Add to Wishlist
    Download
    AI Customize
    A slide showing the colorful MOSCOW method for project priorities with each category labeled and described on a white theme.
    Add to Wishlist
    Download
    AI Customize
    Red and black diagram with a magnifying glass focusing on three analysis sections with icons inside.
    Add to Wishlist
    Download
    AI Customize
    Market analysis PowerPoint template featuring six percentage milestones from 30 to 90 with corresponding captions.
    Add to Wishlist
    Download
    AI Customize
    Market analysis infographic with a yellow open box at the bottom, connected to four colored captions labeled 1 to 4.
    Add to Wishlist
    Download
    AI Customize
    A PPT slide showcasing a business analytics theme with icons for analysis, data, and insights, surrounded by six captions.
    Add to Wishlist
    Download
    AI Customize
    Business analysis slide showcasing steps with icons around a central illustration with a text description.
    Add to Wishlist
    Download
    AI Customize
    Competitor analysis presentation slide featuring progress bars with business building background with placeholder text.
    Add to Wishlist
    Download
    AI Customize
    The Best Situation Analysis Template Slide Presentation
    Add to Wishlist
    Download
    AI Customize
    Dark themed slide featuring analytics elements, including a magnifying glass, mobile device, and percentages in bold.
    Add to Wishlist
    Download
    AI Customize
    Slides featuring Venn diagrams and flowcharts in blue, purple, and orange, explaining diversity, equity, and inclusion.
    Add to Wishlist
    Download
    AI Customize
    Financial analysis slide with icons of coins, hand with cash, transaction, and refund on clipped sheets.
    Add to Wishlist
    Download
    AI Customize
    Easily Usable Performance PPT And Google Slides Template
    Add to Wishlist
    Download
    AI Customize
    Six pie analysis charts in blue, red, orange, green, teal, and purple, displaying percentages from 15% to 90%.
    Add to Wishlist
    Download
    AI Customize
    A colorful risk analysis matrix slide chart, displaying low, medium, high, and extreme risk levels in a grid format.
    Add to Wishlist
    Download
    AI Customize
    Linear timeline showing red triangular nodes connected by dots, each node containing an icon and caption.
    Add to Wishlist
    Download
    AI Customize
    Attractive Business Analytics PowerPoint Template Design