Editable Performance PowerPoint And Google Slides Theme
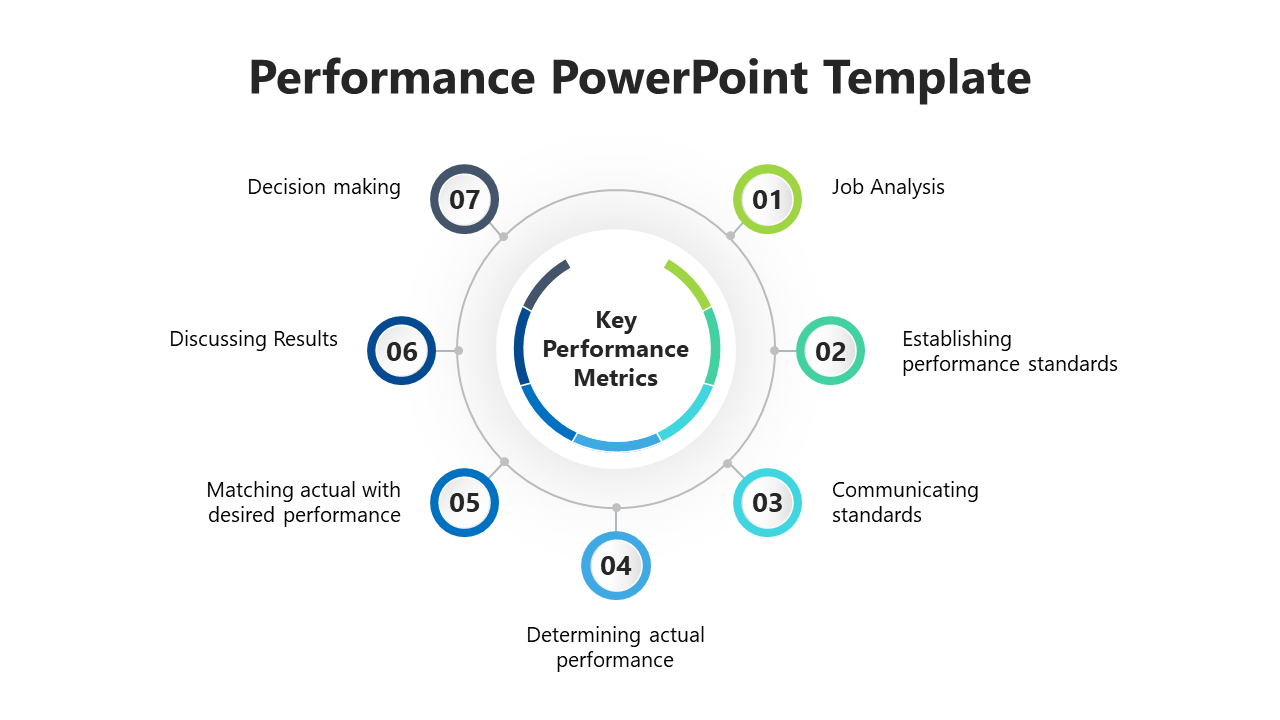
Infographic showing seven-step performance cycle in a circular layout, each step marked with colored numbers and labels.
P.ID : 44114
    206 views
    34 Downloads
    Designer
    Kavitha
    Get Custom Slides by Experts
    Enhance Your Presentations with Add-ins
    Google Slides Add-in
    Access templates directly in Google Slides
    Microsoft PowerPoint Add-in
    Access templates directly in PowerPoint
    GPT Add-on
    AI-powered presentation assistance

    PPT Slide for Performance

    Why stick to the ground when you can make quick headways? The slide gives you an inside look at your staff, their performance, and sales. A pristine, stylish design emphasizes your performance. Your audience will love it and feel inspired by your hard work. It's handy to use as an employee or customer dashboard or performance chart. Treat your peers to a slide that is just as cool as they are! Those eight nodes in the blue theme add elegance and eminence to your data. Make your breakneck edits with this slide now.

    Features of the template

    • 100% customizable slides and easy to download.
    • Slides are available in different nodes & colors.
    • The slide contains 16:9 and 4:3 formats.
    • Easy to change the colors of the slide quickly.
    • Well-crafted template with an instant download facility.
    • Vibrant eight-node hues. 
    Advertisement

    You May Also Like These PowerPoint Templates
    Free
    Add to Wishlist
    Download
    Edit
    Slide layout with four outlined boxes, each containing a progress bar, center marker, and right aligned business icons.
    Free
    Add to Wishlist
    Download
    Edit
    Dark background slide featuring a yellow, green, red, and blue pinwheel shape surrounded by captions with percentages.
    Add to Wishlist
    Download
    Edit
    A slide with a magnifying glass and three analysis steps, featuring icons for ideas, financial graphs, and partnerships.
    Add to Wishlist
    Download
    Edit
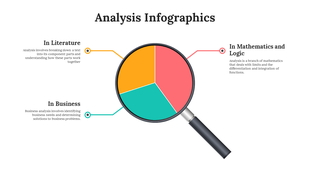
    Technology analysis slide with a colorful pie chart split into orange, pink, and blue segments, alongside a labeled table.