Slidea Logo
Try it now — the new, easy way to turn your slides into an interactive experience.
Explore Now

Root Cause Analysis Report PowerPoint And Google Slides

Pack of 20 slides
P.ID : 76973
Advertisement
1 views
1 Downloads
Get Custom Slides by Experts
Enhance Your Presentations with Add-ins
Google Slides Add-in
Access templates directly in Google Slides
Microsoft PowerPoint Add-in
Access templates directly in PowerPoint
GPT Add-on
AI-powered presentation assistance

Root Case Analysis Report PowerPoint, Google Slides, and Canva Template


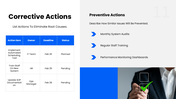
The Root Cause Analysis Report presentation template is designed to help organizations, quality teams, managers, and consultants systematically identify problems and uncover the true root causes behind recurring issues. It provides a structured framework to document problem statements, analyze contributing factors, and present corrective and preventive actions in a clear and logical manner.

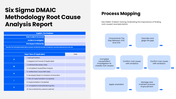
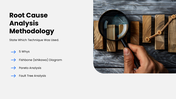
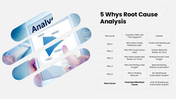
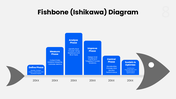
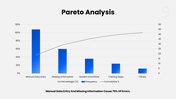
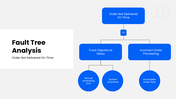
This presentation simplifies complex operational, quality, and process-related issues through clean layouts, structured sections, and proven analytical tools such as DMAIC, process mapping, 5 Whys, Fishbone (Ishikawa) diagrams, and Pareto analysis. These visual methods help stakeholders clearly understand why the issue occurred, where breakdowns happened, and which causes have the highest impact.

Ideal for manufacturing, IT, healthcare, logistics, finance, and service industries, this template supports quality reviews, audits, incident investigations, performance improvement initiatives, and compliance reporting. It enables teams to communicate findings with clarity, accuracy, and data-driven insight, supporting better decision-making and long-term process improvement.

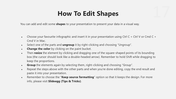
Each slide is fully editable, allowing you to customize text, charts, diagrams, icons, and visuals to suit your specific issue, industry, and audience. Whether the focus is quality defects, operational delays, system failures, or customer complaints, the layout adapts easily to different analysis scenarios.


Compatible with PowerPoint, Google Slides, and Canva, this Root Cause Analysis Report template ensures smooth editing and consistent design quality across all platforms.


Features of this template

  • 100% customizable slides and easy to download.
  • The slides contain 16:9 and 4:3 formats.
  • Easy to change the colors quickly.
  • Highly compatible with PowerPoint, Google Slides, and Canva templates.

You May Also Like These PowerPoint Templates

Free
Add to Wishlist
Download
AI Customize
Add to Wishlist
Download
AI Customize
Performance slide with four quadrants in red, green, teal, and blue, connected in a circular flow with relevant text.
Free
Add to Wishlist
Download
AI Customize
Vertical bar chart with five captions and a magnifying glass highlighting one, and numbered list with text on the right.
Add to Wishlist
Download
AI Customize
Hexagon layout with captions in teal, blue, and pink, connected to numbered nodes on a dotted gray background.
Add to Wishlist
Download
AI Customize
Slide with an orange upright and a purple inverted triangle, each featuring icons and four numbered captions around them.
Add to Wishlist
Download
AI Customize
Magnifying glass with two speech bubbles on the left and four colored analysis sections with checkmark icons on the right.
Add to Wishlist
Download
AI Customize
Market analysis infographic with a yellow open box at the bottom, connected to four colored captions labeled 1 to 4.
Add to Wishlist
Download
AI Customize
 slide featuring three circular charts for data analysis, followed by a line chart displaying monthly trends.
Add to Wishlist
Download
AI Customize
Five numbered hexagons in red, orange, green, teal, and blue, each with text inside.
Add to Wishlist
Download
AI Customize
Pack of slides with colorful icons and sections for various data analysis, including visuals and layouts.
Add to Wishlist
Download
AI Customize
Slide featuring five colorful cylindrical bar charts labeled with data analytics categories with percentages from 23% to 75%.
Add to Wishlist
Download
AI Customize
A market analysis slide featuring visual data representation with charts illustrating quantitative statistics with captions.
Add to Wishlist
Download
AI Customize
Infographic showing seven-step performance cycle in a circular layout, each step marked with colored numbers and labels.
Free
Add to Wishlist
Download
AI Customize
Competitor analysis chart slide comparing four companies across various categories.
Add to Wishlist
Download
AI Customize
Financial slide deck with a navy blue theme, featuring sections on company mission, analysis types, and team profiles.